Last updated: July 22, 2025
How to Monitor Table Availability? Examples and Best Practices
Read this guide to learn how to enable table availability monitoring. You can detect when the table is not available, or a table is physically corrupted.
The table availability monitoring checks are configured in the availability category in DQOps.
What is a table availability issue
We have a table availability issue when even a simple query cannot be run on a table. The table is not reachable.
There are many reasons for table availability issues.
- The database server is down.
- Networking issues.
- Firewall issues.
- Invalid permissions to the table.
- The table is physically corrupted on the disk.
- Credentials expired or were changed.
Detecting table availability issues
DQOps runs a simple query that tries to read only one row from a monitored table.
SELECT
    *
FROM "your_postgresql_database"."<target_schema>"."<target_table>" AS analyzed_table
LIMIT 1
Configure table availability monitoring
The table availability check is configured by setting the maximum number of allowed consecutive table availability issues. The preferred method of monitoring table availability is by using a daily table availability check that is run daily.
Maximum allowed failures
The table availability check in DQOps uses a parameter to configure thresholds for different issue severity levels.
The max_failures parameter sets the number of consecutive table availability failures that
DQOps tolerate before raising a data quality issue.
-
max_failuresequal to 0 instantly raises a data quality issue when a problem with availability is detected. -
max_failuresequal to 1 raises a data quality issue the second time the availability issue was detected because the first failure was ignored (but counted). -
max_failuresequal to 5 raises a data quality issue when the availability issue was detected for the sixth time (six days in a row).
YAML
The example below shows how to enable table availability monitoring in a YAML file.
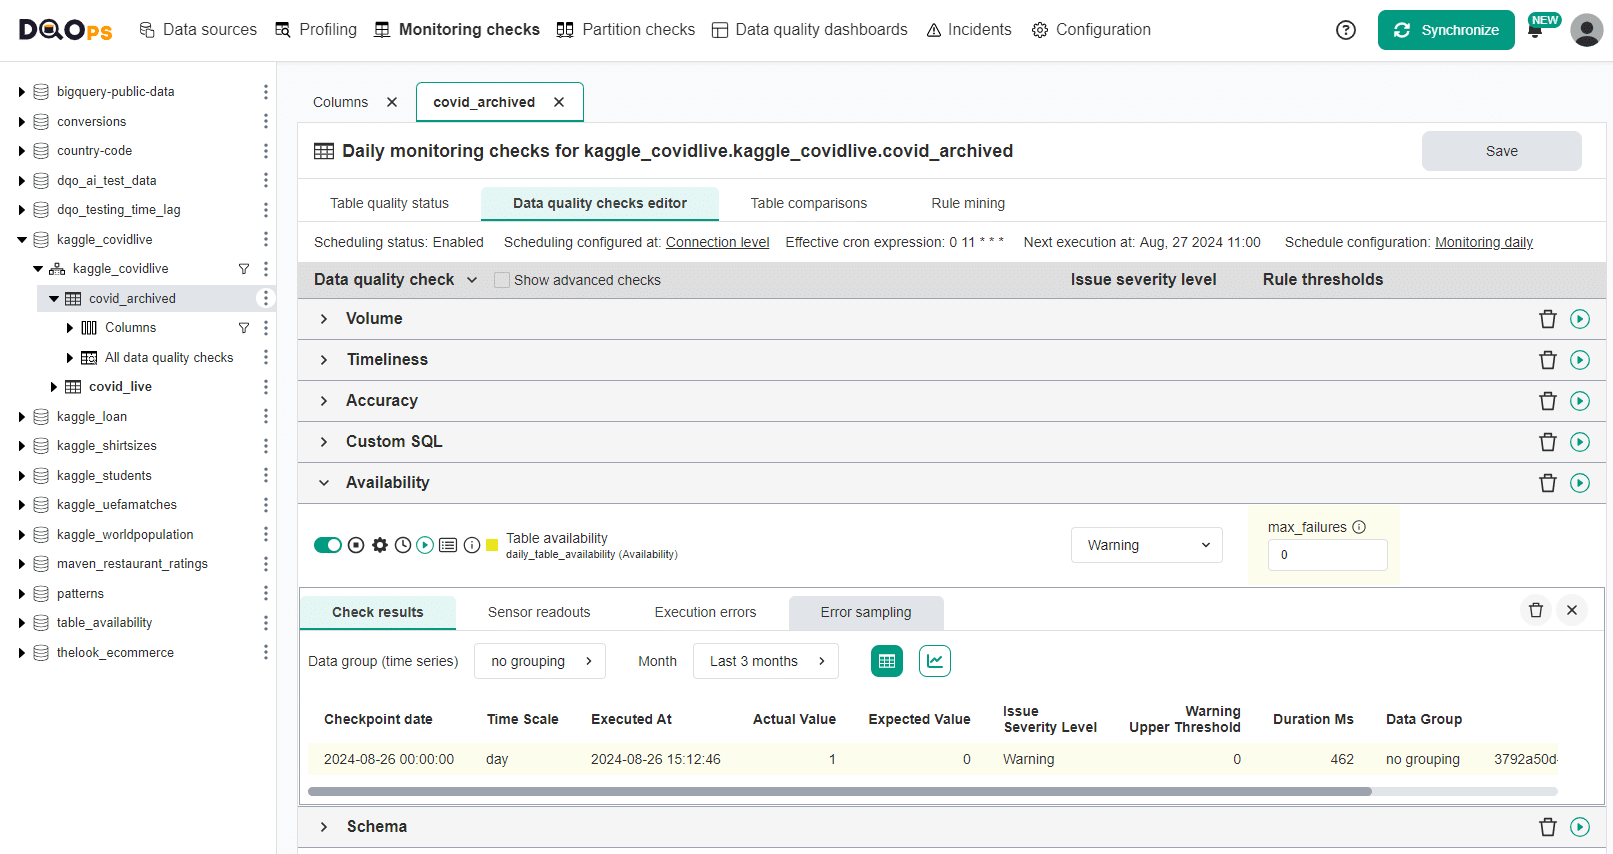
User interface
The table availability monitoring can be also enabled in the check editor.
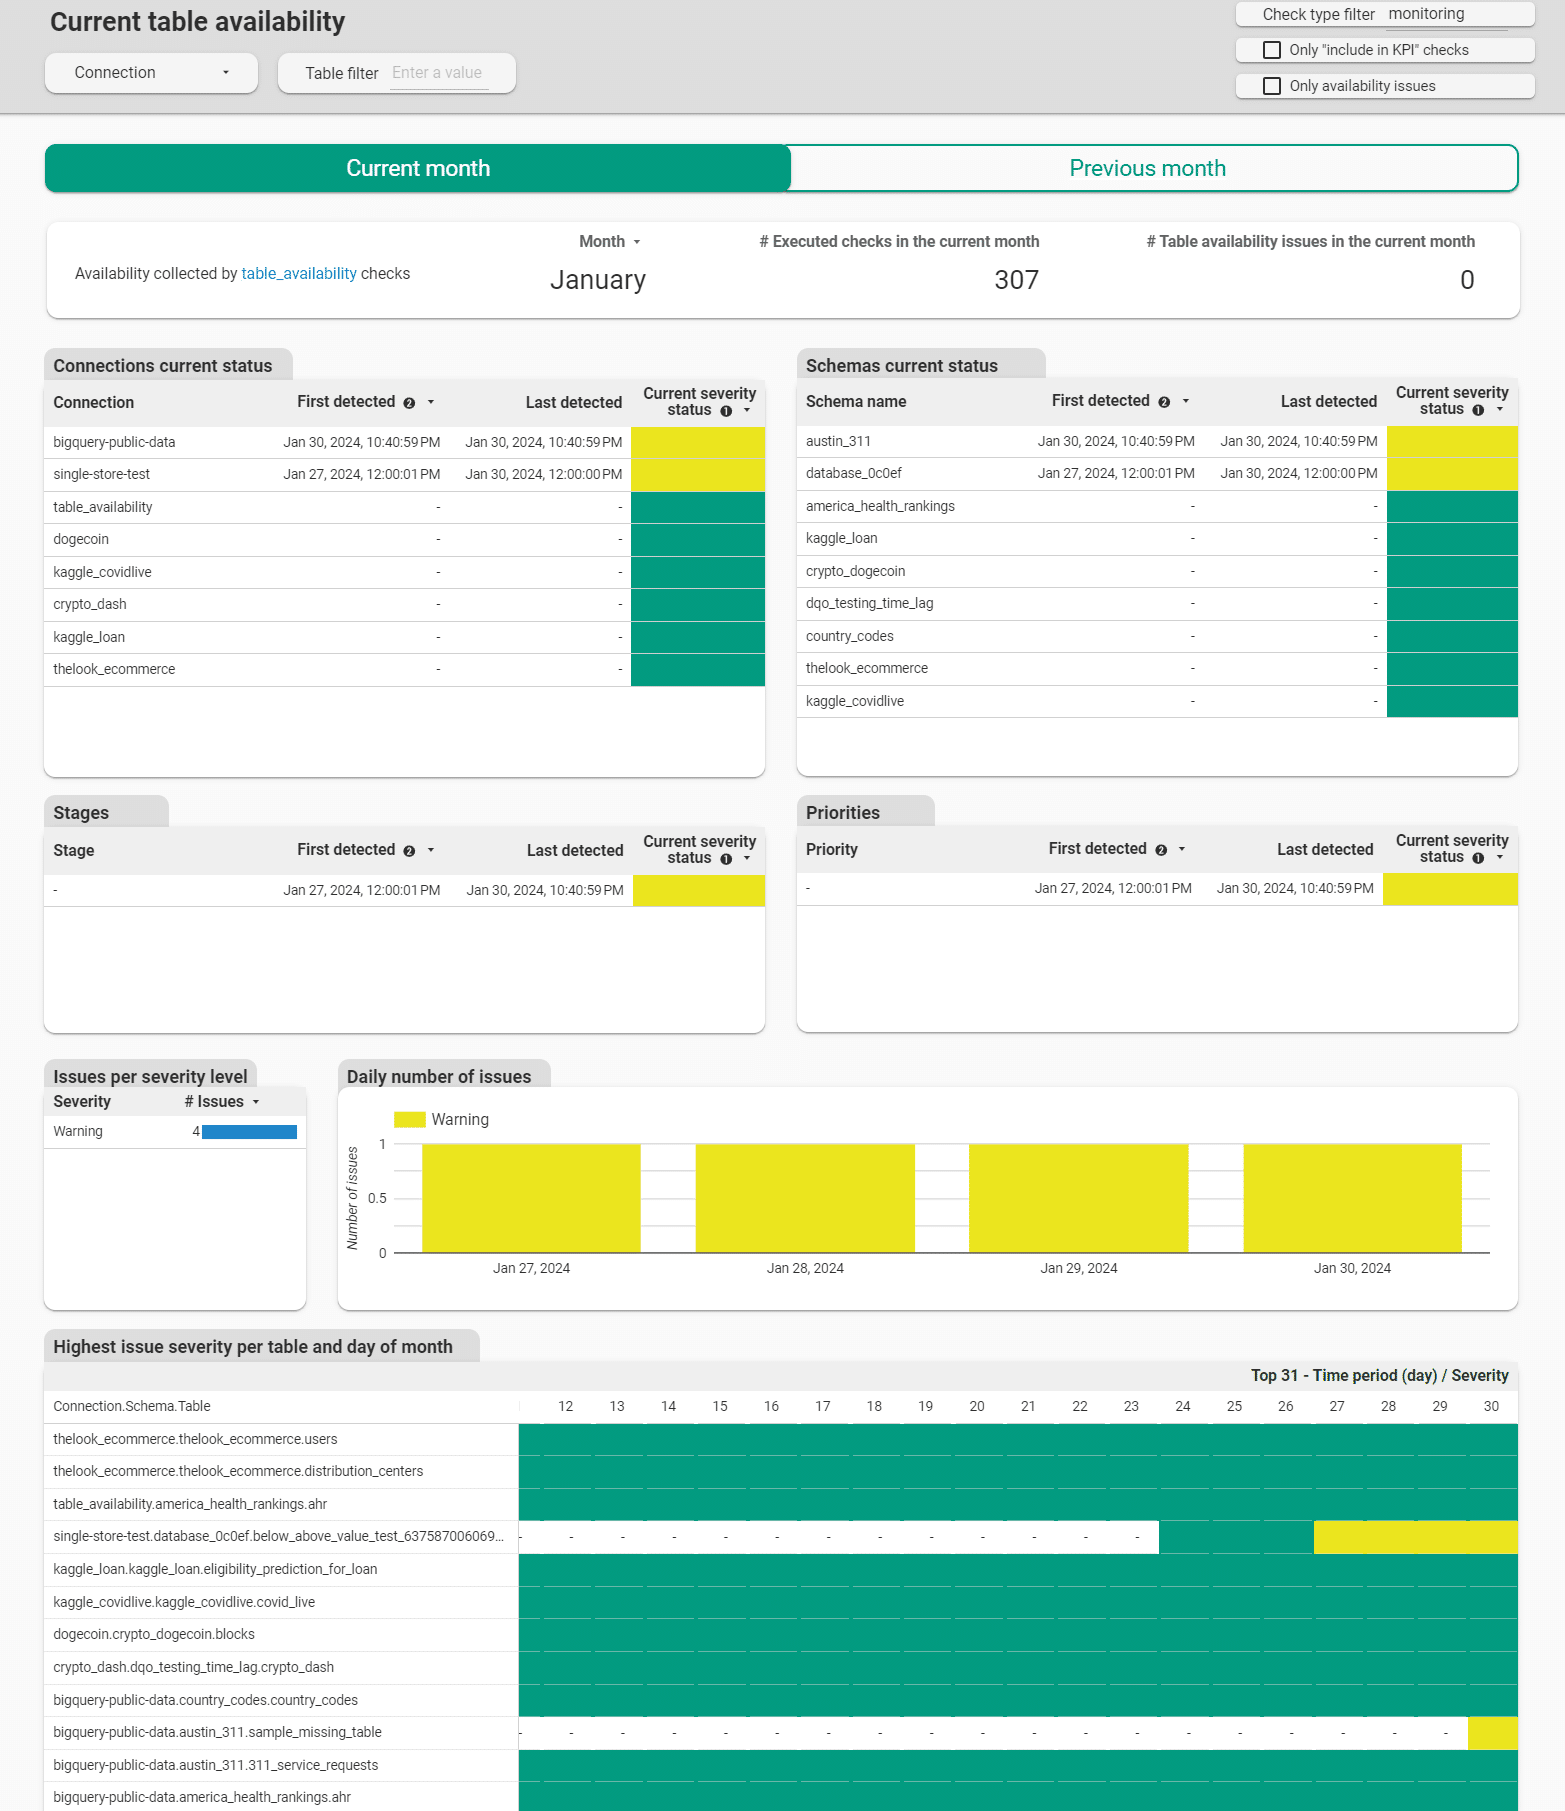
Monitoring table availability on dashboards
DQOps provides dedicated data quality dashboards for monitoring table availability issues. The dashboard shows a calendar for each day of month, when the table availability issue was detected.
Use cases
| Name of the example | Description |
|---|---|
| Detect table availability issues | This example shows how to verify that a query can be executed on a table and that the server does not return errors using table_availability check. |
List of availability checks at a table level
| Data quality check name | Friendly name | Data quality dimension | Description | Standard check |
|---|---|---|---|---|
| table_availability | Table availability | Availability | A table-level check that ensures a query can be successfully executed on a table without server errors. It also verifies that the table exists and is accessible (queryable). The actual value (the result of the check) indicates the number of failures. If the table is accessible and a simple query can be executed without errors, the result will be 0.0. A sensor result (the actual value) of 1.0 indicates that there is a failure. Any value greater than 1.0 is stored only in the check result table and represents the number of consecutive failures in the following days. |
Reference and samples
The full list of all data quality checks in this category is located in the table/availability reference. The reference section provides YAML code samples that are ready to copy-paste to the .dqotable.yaml files, the parameters reference, and samples of data source specific SQL queries generated by data quality sensors that are used by those checks.
What's next
- Learn how to run data quality checks filtering by a check category name
- Learn how to configure data quality checks and apply alerting rules
- Read the definition of data quality dimensions used by DQOps