Last updated: July 22, 2025
How to Reconcile Data with Table Comparison Checks, Examples
Read this guide to learn how to reconcile data across data sources to find discrepancies using table comparison data quality checks.
Data reconciliation checks are defined in the comparisons category in DQOps.
What is data reconciliation
Data reconciliation is a verification process that ensures that the data in two data sources match and no errors were induced when the data was transferred or transformed. Data reconciliation is performed by pulling and comparing the data from both data sources.
Data reconciliation also applies to more than just two tables. We can compare a table to other data sources, called the source-of-truth. We can also compare a target table to a source table earlier in the data lineage, such as an upstream table. A complete data reconciliation may require performing multiple table comparisons.
Data reconciliation use cases
Comparing tables is an essential step during any data migration project. We can ensure that all records were migrated correctly and no data is missing only by comparing tables in the new database to the original tables in the old database. It is a one-time process before closing the migration project.
Data reconciliation becomes essential when we apply Data Observability practices, monitoring the discrepancies between data sources at regular intervals. DQOps supports running data reconciliation daily and monthly.
The other use cases for data reconciliation that depend on monitoring are:
-
Comparing the same table across the data lineage. For example, comparing a table in the landing zone to a table in the staging zone.
-
Comparing the same tables between an OLTP database (the data source-of-record table) and a reporting copy of the table in the data warehouse.
-
Comparing the aggregated cost in the fact table to the aggregated cost on the invoices aggregated by the finance department.
Issues detected by data reconciliation
Data reconciliation can detect several data quality issues that are hard to notice by other methods.
-
Missing data.
-
Duplicate data.
-
Null values after data transformation.
-
Invalid values.
-
Conversion errors.
Data reconciliation with DQOps
DQOps uses the term table comparison to describe the process of comparing one pair of tables. A table comparison identifies both tables and specifies the columns that are used to match rows between the tables.
The roles of the tables involved in the table comparison are:
-
The compared table is the target table that we are validating.
-
The reference table is the source table that is our source-of-truth.
To compare the two tables, we must also map columns between the tables and specify the identity columns that identify rows or groups of rows to compare.
DQOps stores the configuration of the table comparison in the metadata of the compared table.
Comparing aggregated values
Data reconciliation in DQOps is not limited to comparing tables row-by-row. There are many relevant business cases when the compared tables store data at different aggregation levels. One table stores all records, for example, a fact table in a data warehouse. While the other table stores only an aggregated value, for example, an account summary table that tracks an aggregated monthly total revenue for each customer.
In that case, we can compare the tables only by grouping the fact table also by the month of sale and the customer identifier. The table comparison must also calculate an aggregated (total) revenue for each customer for every month.
Table mapping in DQOps UI
The following image shows the table comparison configuration in DQOps. The table comparison is defined on the compared table and specifies the reference table. The tables are compared by grouping rows by the county and city columns and comparing aggregated measures.
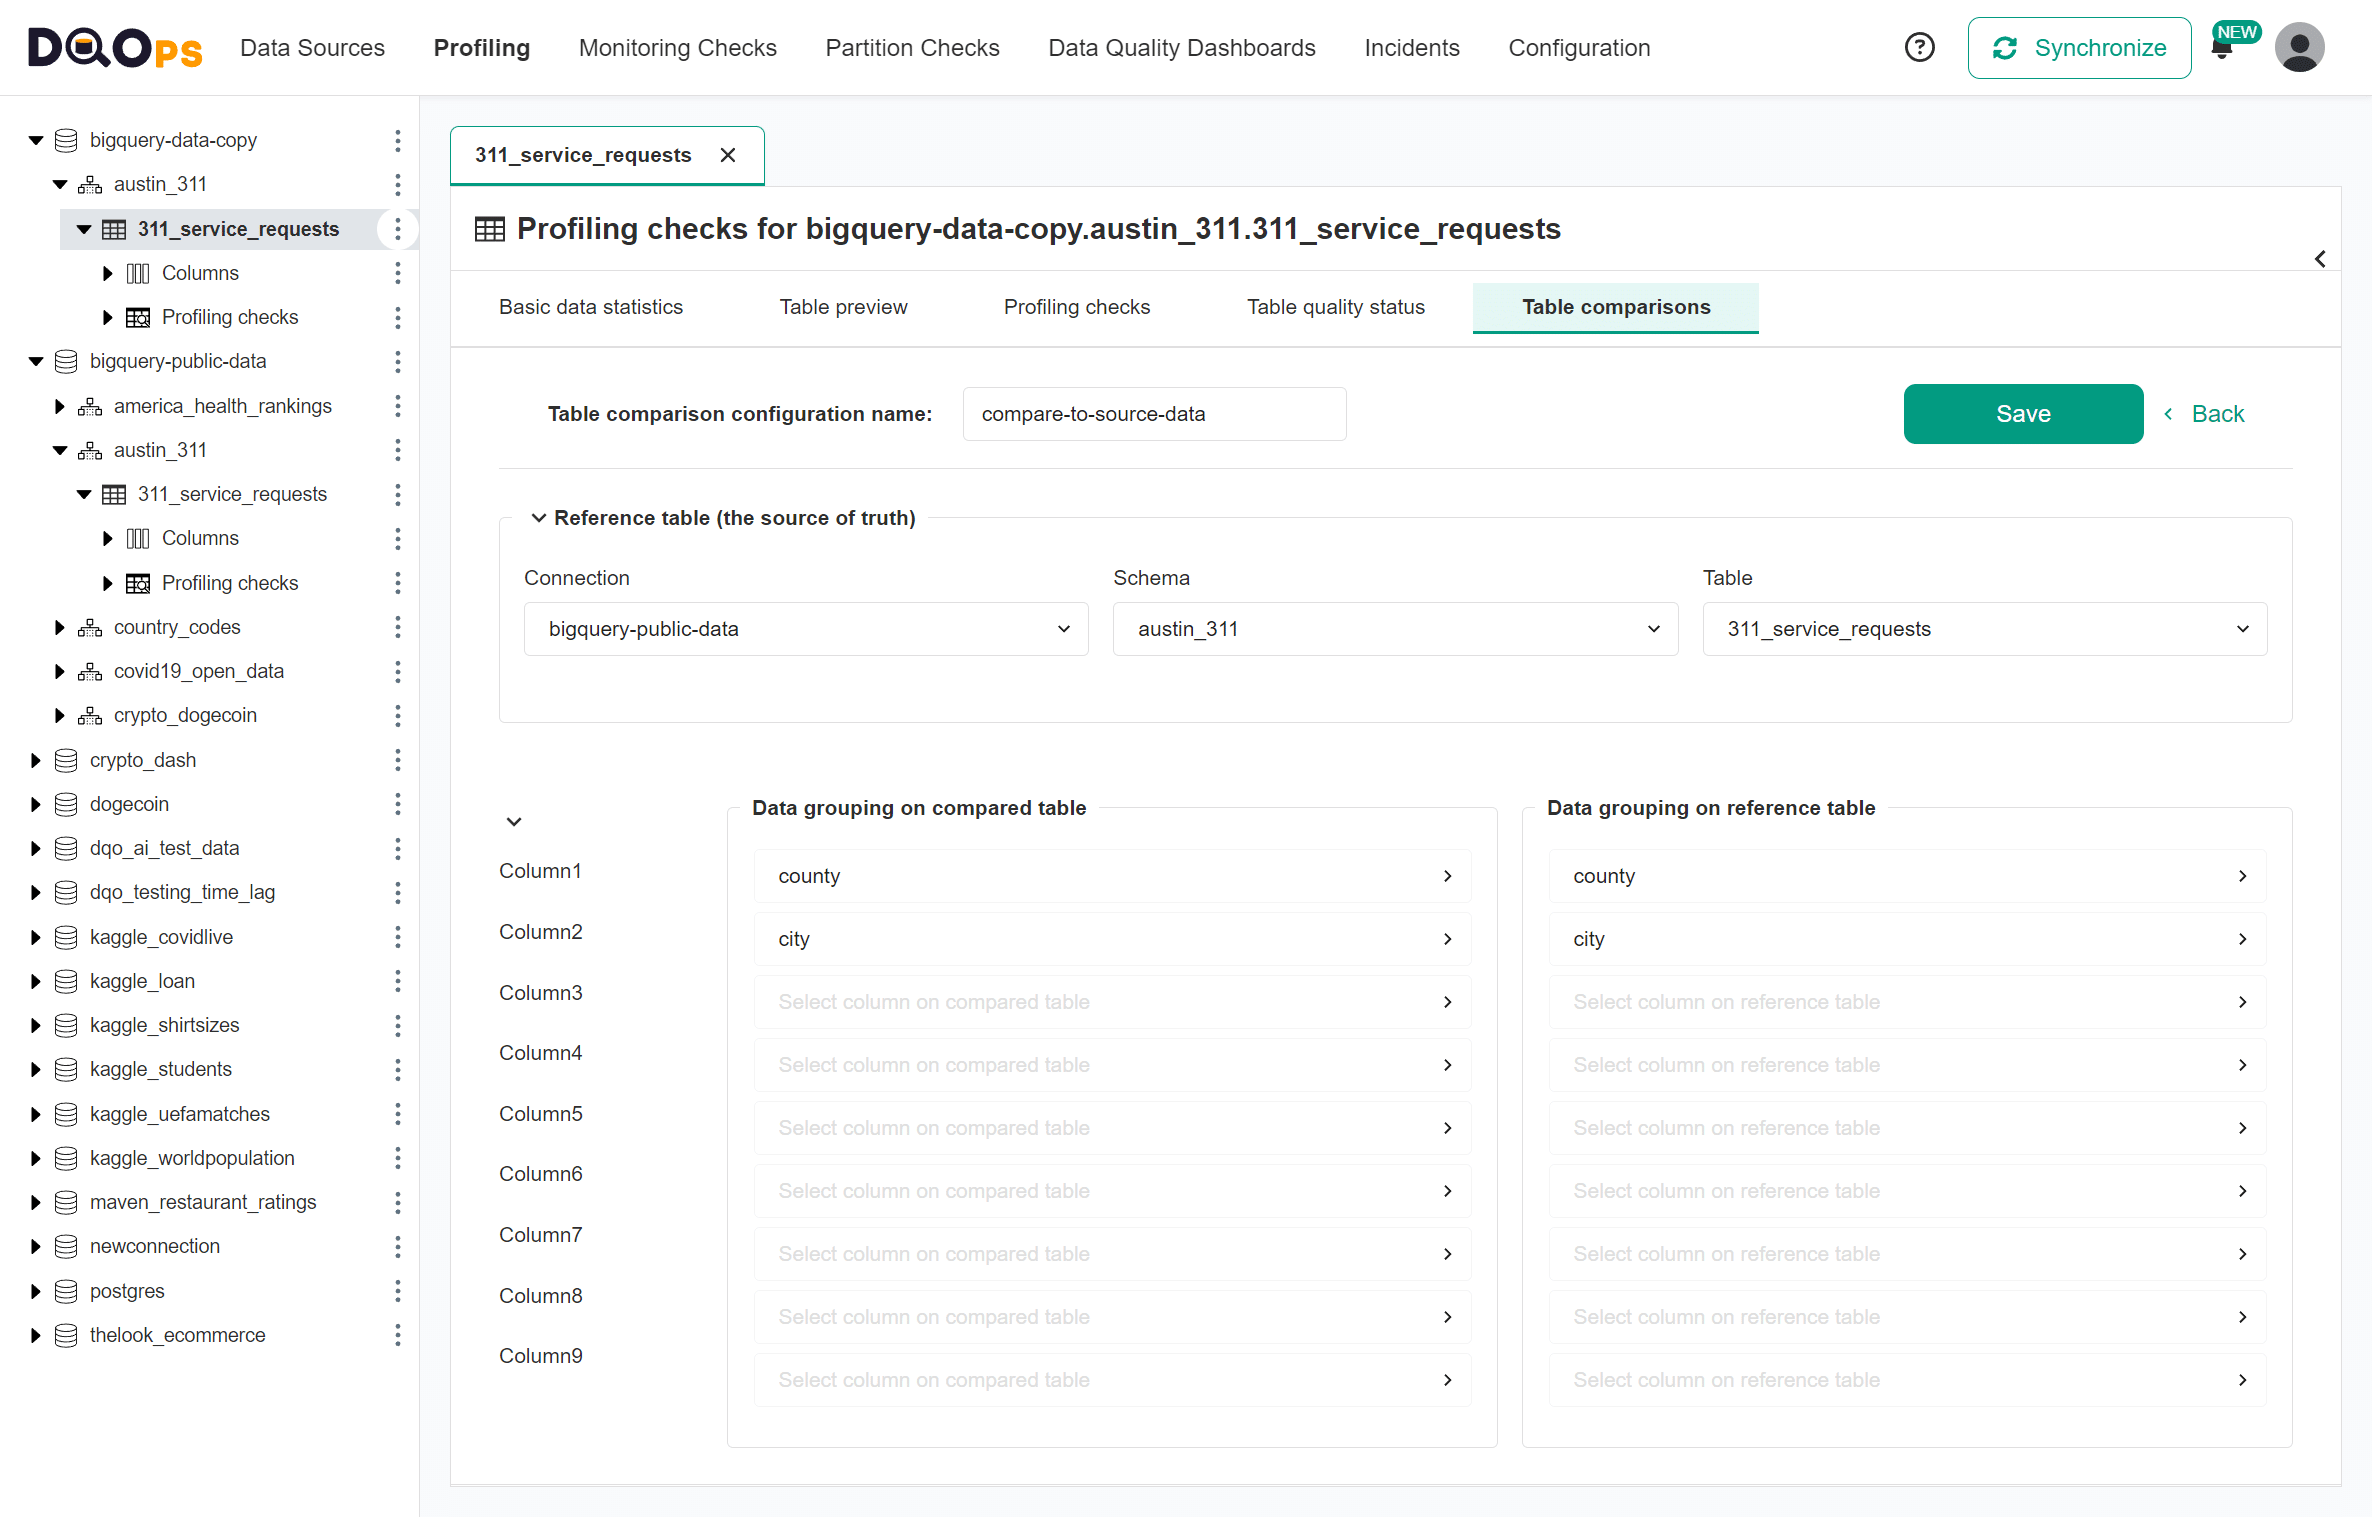
Please read the manual for comparing tables in the working with DQOps section to see an entire process, including cleaning the data quality check results after performing the table comparison.
Compared metrics
When comparing aggregated values, we must also choose the types of aggregation that we are comparing. DQOps compares aggregated metrics at a whole table level and for each compared pair of columns.
The table-level metrics are the row and column counts.
The column-level metrics are:
-
The minimum value.
-
The maximum value.
-
The sum of values.
-
The mean (average) of values.
-
The number of null values.
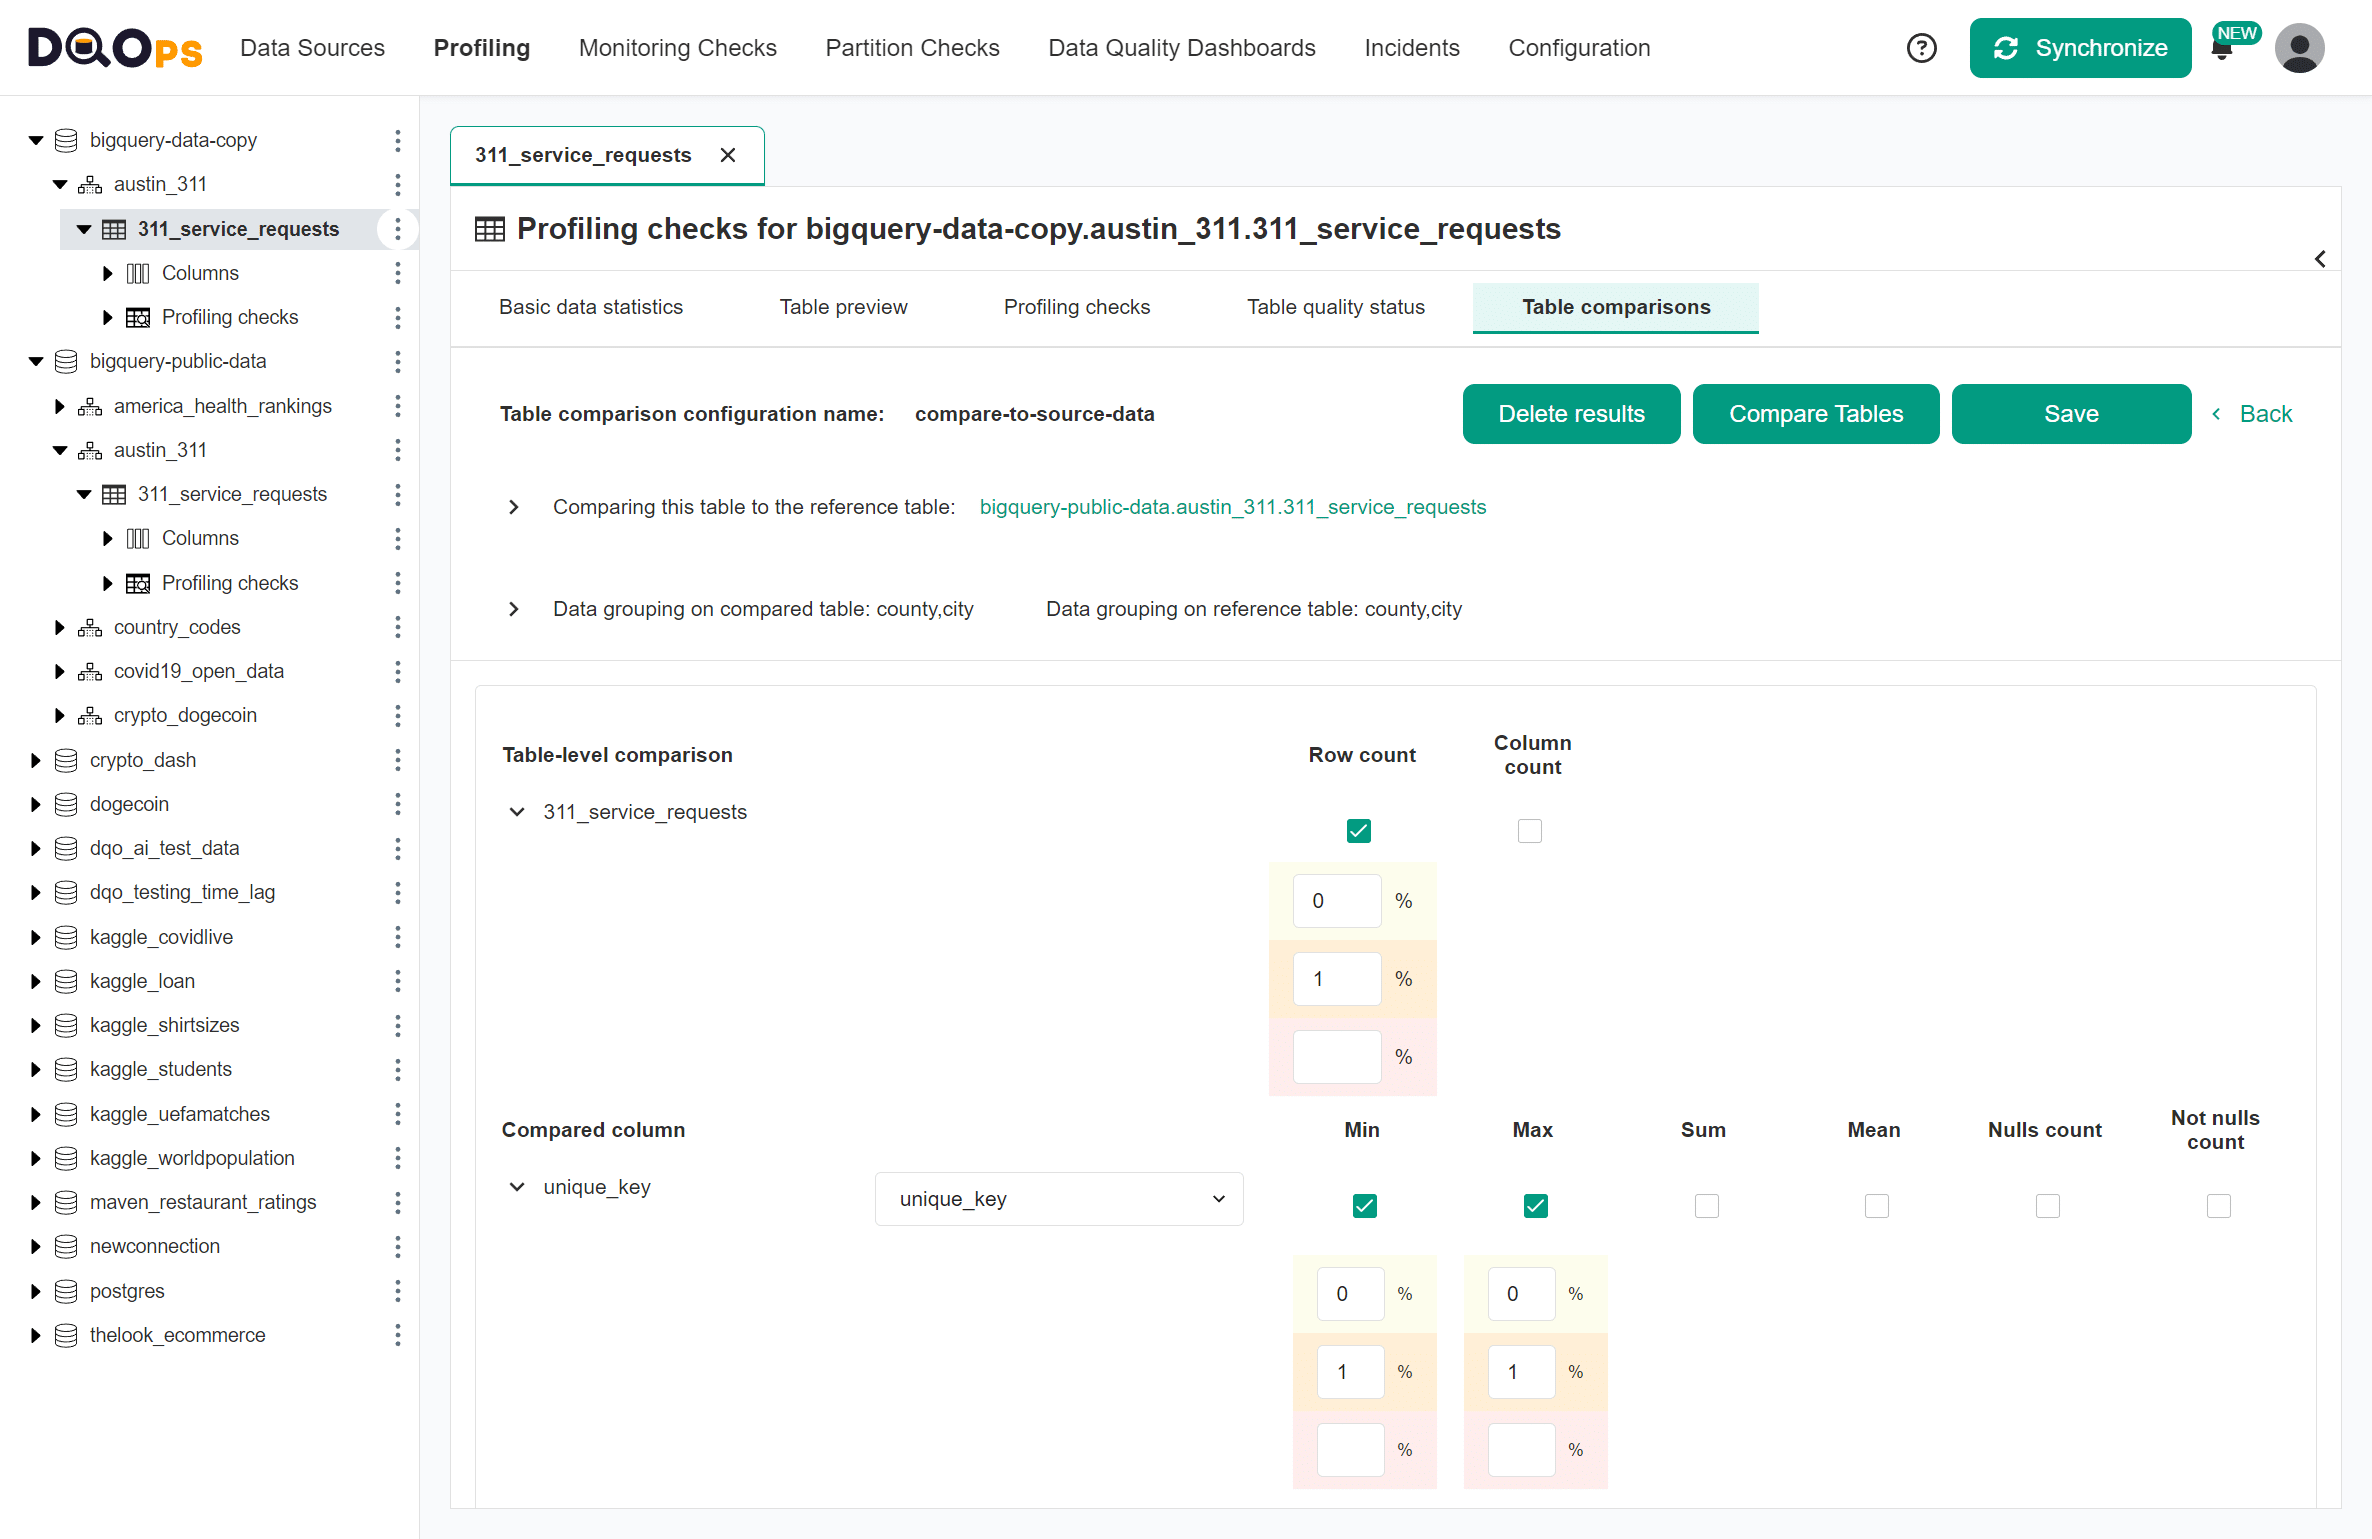
Accepted discrepancy level
DQOps also uses the concept of data quality issue severity levels to configure the thresholds of the accepted discrepancy between the metrics on the two compared tables.
The default alerting thresholds enabled by DQOps are listed below.
| Data quality issue severity level | Field background color | Default value |
|---|---|---|
| Warning | Light yellow | 0.0% |
| Error | Light orange | 1.0% |
| Fatal | Light red | (not set) |
The configuration of thresholds is collapsed by default. Please use the expand icon to show the detailed settings.
Comparing data for time periods
DQOps supports a special type of data quality checks that analyze data by applying a GROUP BY <time_period> clause to SQL queries.
These data quality are named partitioned checks.
They are configured in the "Partition Checks" section of the DQOps user interface.
A partitioned table comparison check applies an additional grouping column in the GROUP BY clause.
It is the value of the partition_by_column date column, truncated to the beginning of the day or the first day of the month.
Data reconciliation of daily or monthly partitioned data is usable in the following cases.
-
Compare partitions for the same day between a source and a target table.
-
Reconcile data in monthly periods for append-only data that cannot be updated afterward.
-
Reconcile financial data between fact tables and the total monthly cost or revenue received from the finance department.
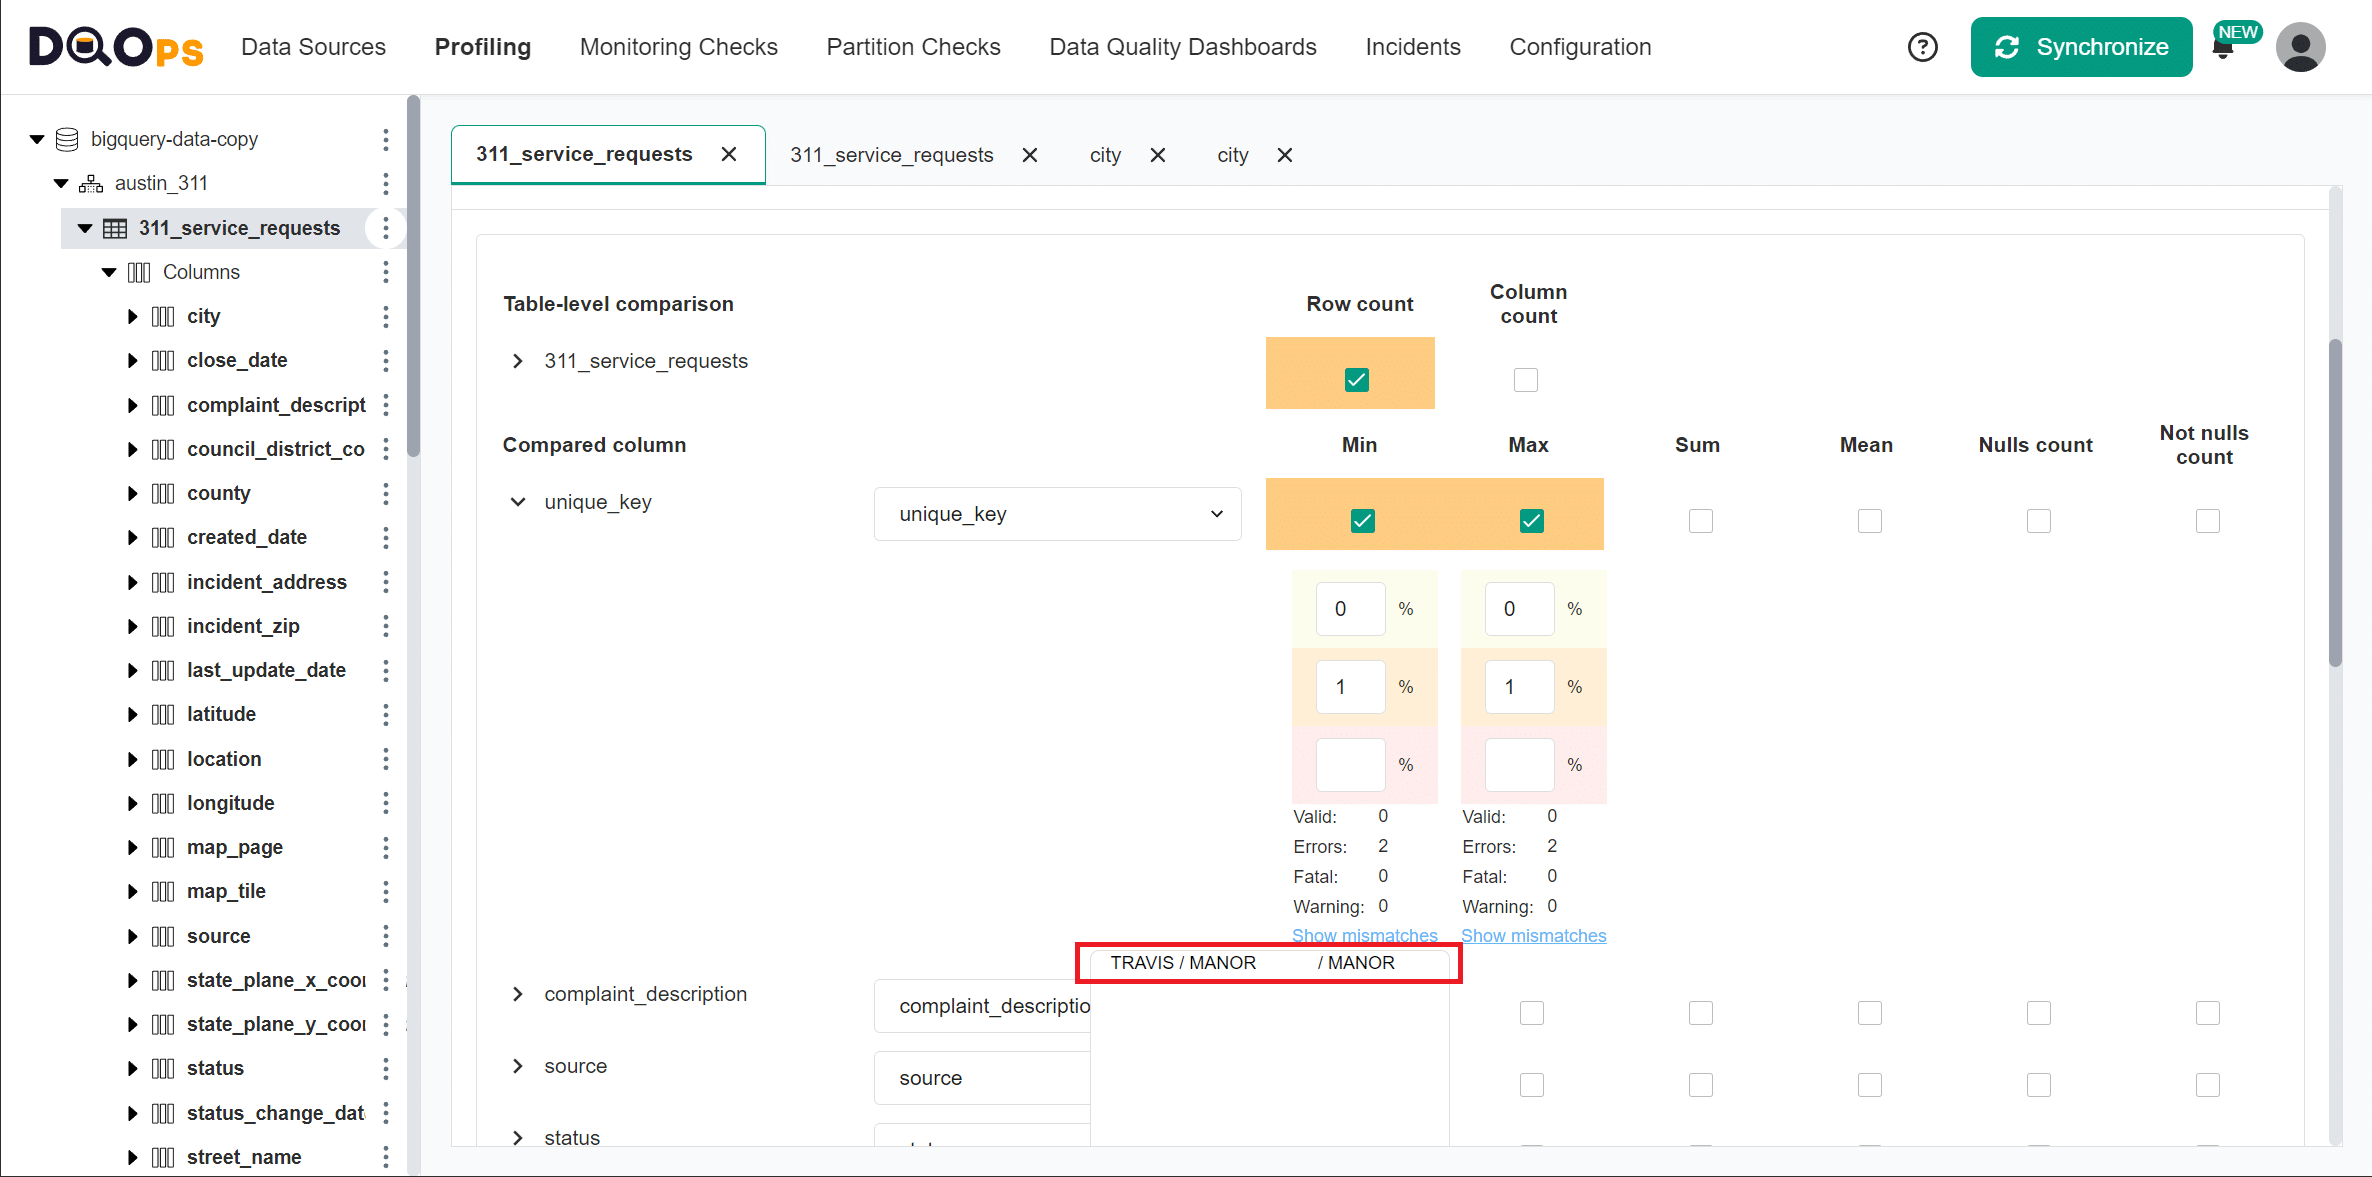
Data reconciliation discrepancies
The table comparison screen below highlights the metrics that were compared. The identified discrepancies are highlighted by DQOps using a background color of each data quality issue severity levels.
| Cell background color | Severity level |
|---|---|
| Yellow | Warning |
| Orange | Error |
| Red | Fatal |
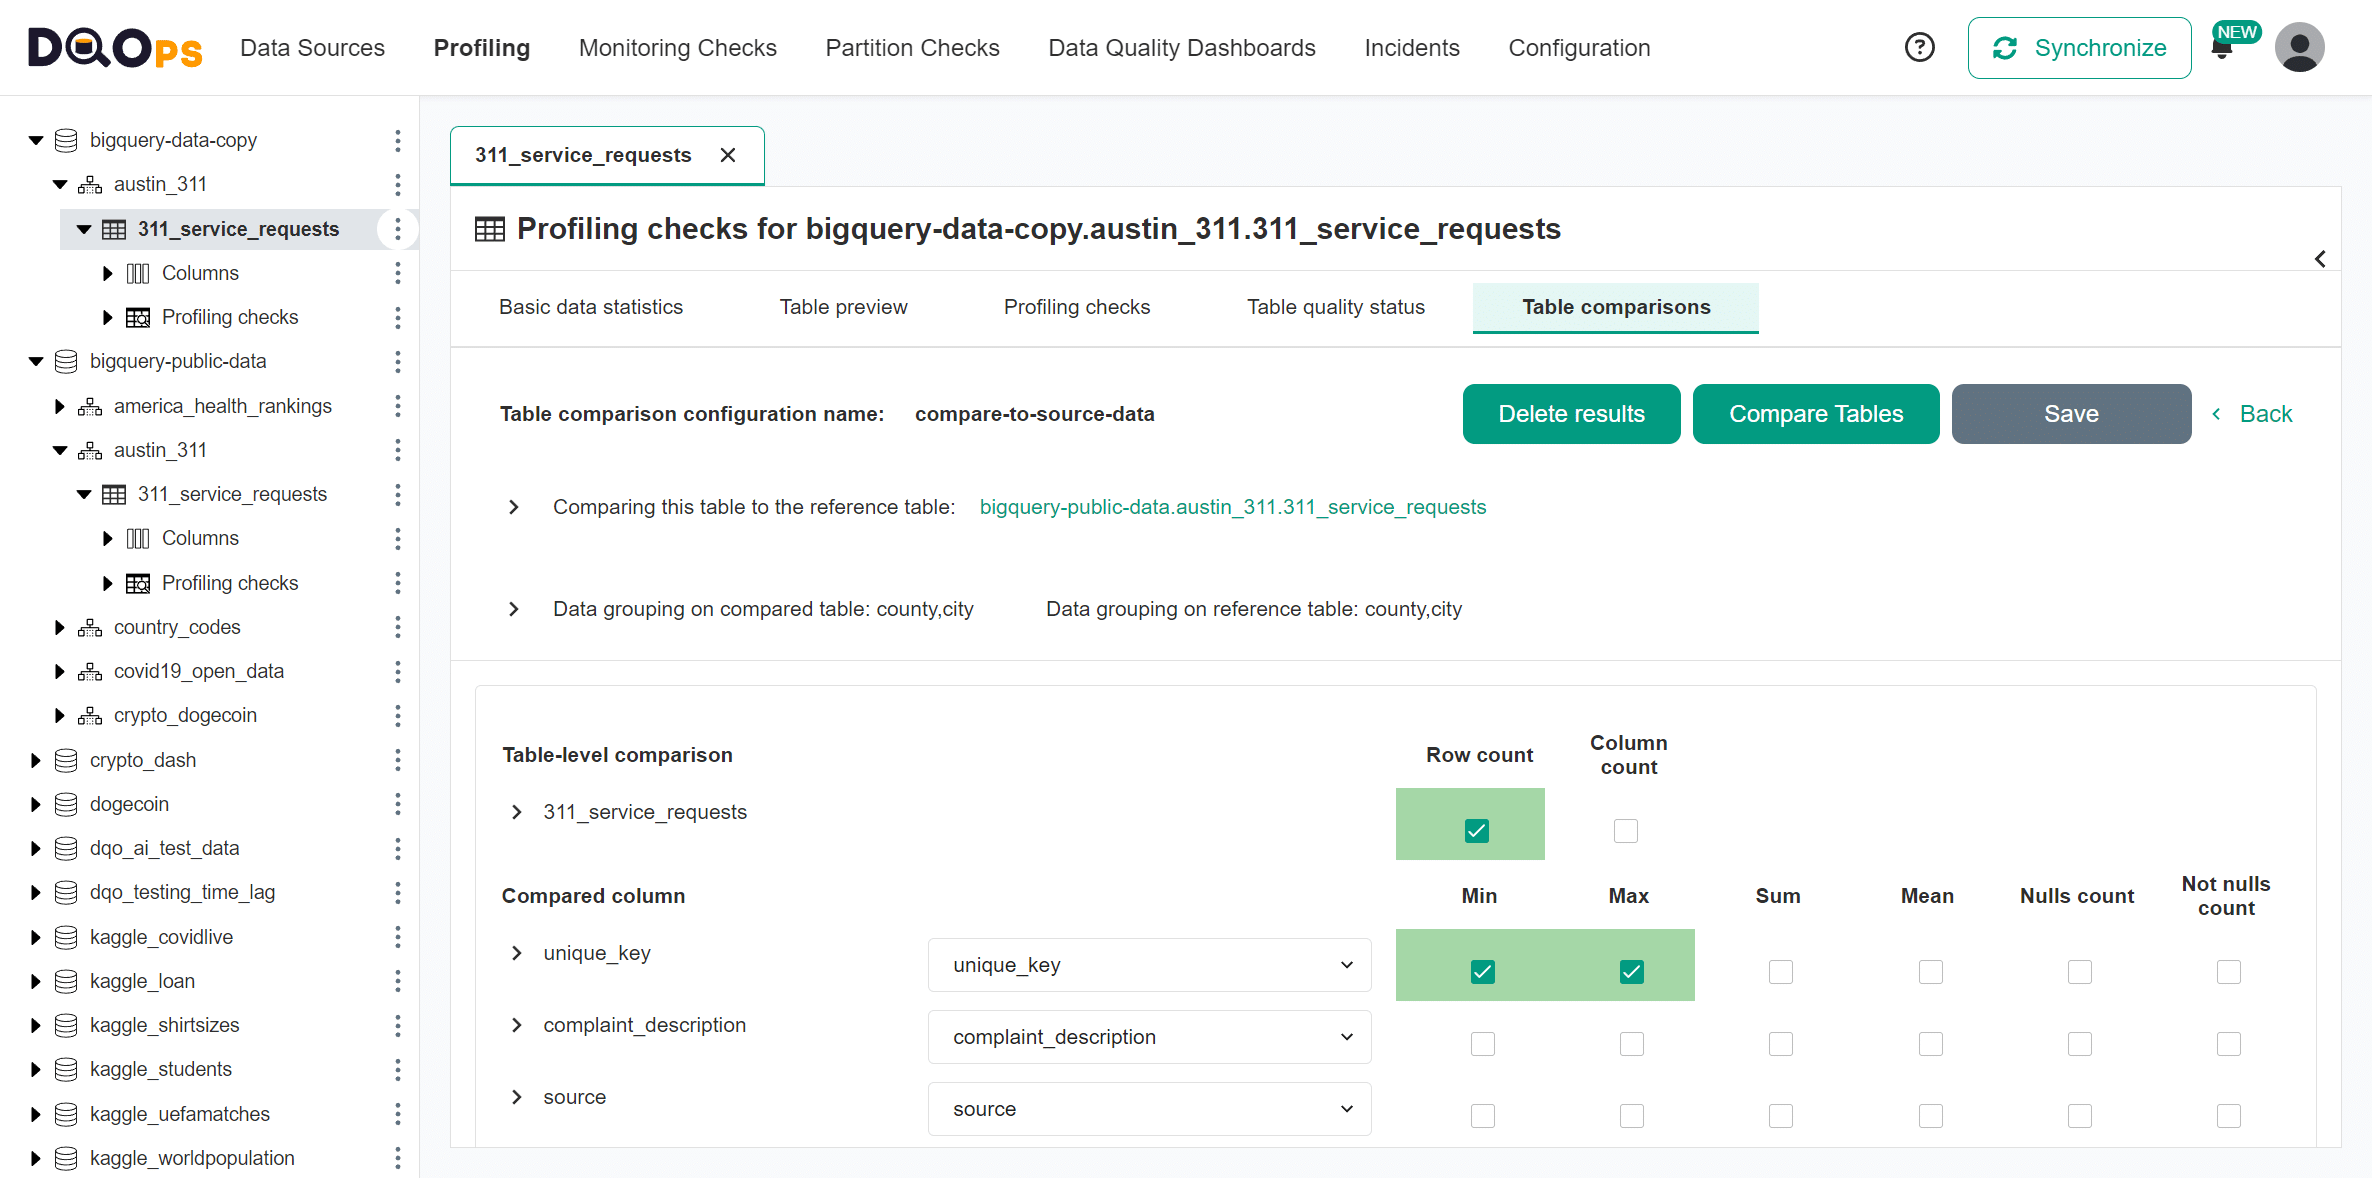
Tables match
When all metrics match, DQOps shows the cells using a green background.
Discrepancies detected
We are introducing a discrepancy on the rows whose city value is MANOR.
For the purpose of this example, the error is injected by configuring
a table filter city <> 'MANOR'.
Configuring table comparison in YAML
The configuration of table comparisons is divided into three areas.
-
The configuration of the mapping to the reference table and the list of grouping columns.
-
The configuration of the table-level comparison checks: the row count and the column count match.
-
The configuration of the column-level comparison checks: min, max, sum, avg, and the count of not-null values.
Table comparison configurations
The list of table comparison configurations is defined in the table_comparisons node.
Each table comparison must have a unique name within a table.
-
The name of a table comparison configuration. DQOps supports the definition of many table comparison configurations.
-
The type of data quality checks for which the comparison is valid.
-
A list of column pair used in the data grouping.
-
The name of a grouping column on the compared table (this table).
-
The name of the grouping column on the reference table.
Table-level comparison checks
Table-level comparison checks are configured inside the comparisons node.
The comparisons node is a dictionary of the data comparison checks indexed by the name of the table comparison configuration.
- The name of the table comparison. Must be one of the names of the table comparisons with a matching check type.
Column-level comparison checks
The configuration of column-level comparison checks is similar to the configuration of table-level checks.
However, there is one crucial difference.
The mapping to the name of the column in the reference table is provided in the reference_column node.
-
The name of the table comparison configuration.
-
The name of the mapped column in the reference table.
List of comparisons checks at a table level
| Data quality check name | Friendly name | Data quality dimension | Description | Standard check |
|---|---|---|---|---|
| row_count_match | Maximum percentage of difference between row count of compared tables | Accuracy | Table level comparison check that compares the row count of the current (parent) table with the row count of the reference table. | |
| column_count_match | Maximum percentage of difference between column count of compared tables | Accuracy | Table level comparison check that compares the column count of the current (parent) table with the column count of the reference table. |
Reference and samples
The full list of all data quality checks in this category is located in the table/comparisons reference. The reference section provides YAML code samples that are ready to copy-paste to the .dqotable.yaml files, the parameters reference, and samples of data source specific SQL queries generated by data quality sensors that are used by those checks.
List of comparisons checks at a column level
| Data quality check name | Friendly name | Data quality dimension | Description | Standard check |
|---|---|---|---|---|
| sum_match | Maximum percentage of difference between sums of compared columns | Accuracy | A column-level check that ensures that compares the sum of the values in the tested column to the sum of values in a reference column from the reference table. Compares the sum of values for each group of data. The data is grouped using a GROUP BY clause and groups are matched between the tested (parent) table and the reference table (the source of truth). | |
| min_match | Maximum percentage of difference between minimum values of compared columns | Accuracy | A column-level check that ensures that compares the minimum value in the tested column to the minimum value in a reference column from the reference table. Compares the minimum values for each group of data. The data is grouped using a GROUP BY clause and groups are matched between the tested (parent) table and the reference table (the source of truth). | |
| max_match | Maximum percentage of difference between maximum values of compared columns | Accuracy | A column-level check that ensures that compares the maximum value in the tested column to maximum value in a reference column from the reference table. Compares the maximum values for each group of data. The data is grouped using a GROUP BY clause and groups are matched between the tested (parent) table and the reference table (the source of truth). | |
| mean_match | Maximum percentage of difference between mean (average) values of compared columns | Accuracy | A column-level check that ensures that compares the mean (average) of the values in the tested column to the mean (average) of values in a reference column from the reference table. Compares the mean (average) value for each group of data. The data is grouped using a GROUP BY clause and groups are matched between the tested (parent) table and the reference table (the source of truth). | |
| not_null_count_match | Maximum percentage of difference between the counts of not null values in compared columns | Accuracy | A column-level check that ensures that compares the count of not null values in the tested column to the count of not null values in a reference column from the reference table. Compares the count of not null values for each group of data. The data is grouped using a GROUP BY clause and groups are matched between the tested (parent) table and the reference table (the source of truth). | |
| null_count_match | Maximum percentage of difference between the counts of null values in compared columns | Accuracy | A column-level check that ensures that compares the count of null values in the tested column to the count of null values in a reference column from the reference table. Compares the count of null values for each group of data. The data is grouped using a GROUP BY clause and groups are matched between the tested (parent) table and the reference table (the source of truth). | |
| distinct_count_match | Maximum percentage of difference between the counts of distinct values in compared columns | Accuracy | A column-level check that ensures that compares the count of distinct values in the tested column to the count of distinct values in a reference column from the reference table. Compares the count of distinct values for each group of data. The data is grouped using a GROUP BY clause and groups are matched between the tested (parent) table and the reference table (the source of truth). |
Reference and samples
The full list of all data quality checks in this category is located in the column/comparisons reference. The reference section provides YAML code samples that are ready to copy-paste to the .dqotable.yaml files, the parameters reference, and samples of data source specific SQL queries generated by data quality sensors that are used by those checks.
FAQ
The following knowledgebase answers the most popular questions about data reconciliation.
What is data reconciliation?
Data reconciliation is the process of making sure data in different sources match. Data is reconciled by comparing tables and this feature is supported by many data quality tools. Differences between data sources indicate missing, duplicate or incorrect data.
How to reconcile data?
Data is reconciled by comparing values in two data sources. You have to connect sources to a data quality tool, configure column mapping and aggregations. A data quality tool will compare data across data sources and detect differences.
What are data reconciliation examples?
Data reconciliation is a process of comparing data between data sources. For example, it is used in data migration projects and to compare financial data between different accounting systems. Data reconciliation ensures that data is accurate. Many industries, such as banking and healthcare, require it for regulatory compliance.
Why is reconciliation important in accounting?
Accounting systems track financial records used for financial planning and tax calculations. Business applications track business activities. These two databases must be reconciled to detect differences, such as invoices without an order or mismatches between a data warehouse and an ERP system.
What is a data reconciliation process?
A single-time data reconciliation is a process of comparing two datasets to check if they match. But, in reality, data changes frequently. A long-term data reconciliation process ensures that datasets always match. It uses a data quality tool that reconciles data in regular intervals. The tool manages a notification workflow to inform data owners about discrepancies.
What are data warehouse reconciliation strategies?
Data warehouses contain two types of data: data ingested from data sources and aggregated data in data marts. There are three strategies for reconciling that data: reconcile once, reconcile data after each refresh, or use a data observability tool to reconcile data in regular intervals.
What are data migration reconciliation techniques?
Data reconciliation in data migration projects requires using a data quality tool that can compare data across data sources. Because data can be ingested at different intervals, the best technique is to accept that a few of the most recent records can mismatch.
What are data reconciliation best practices?
Successful data reconciliation requires mapping matching columns across compared datasets, finding which columns are aggregable, knowing the right filters for both data sources, and knowing what level of mismatch is acceptable. This information is required to correctly configure a data reconciliation tool to detect discrepancies.
What is a data reconciliation statement?
A data reconciliation statement is a document that summarizes the results of a data reconciliation process. It typically includes information on the data sources that were compared, the reconciliation period, the number of discrepancies found, and the actions taken to resolve them. Data quality tools can generate these statements using metrics from a data quality metrics database.
How to perform reconciliation for big data?
Due to the huge volume of data, comparing big datasets record-by-record is not practical. Data in both data sources should be aggregated by common columns that clearly identify data streams or entities, such as accounts. When the sum of values within an account in two datasets does not match, you can inform the account owner about the discrepancy.
What is financial data reconciliation?
Financial data reconciliation is a process of comparing financial records across applications or accounting systems. Financial data stored in different systems is often aggregated, such as an account_history table can contain the end-of-day account balance, which should be compared to a sum of transactions.
What is the difference between data reconciliation vs data validation?
Data reconciliation is a process of comparing data in different datasets to check if they match. Data validation tests data in only one dataset and verifies that the values are in the correct format. For example, data validation can verify that all emails in a customer table are in the correct format.
How to perform data aggregation for reconciliation in accounting?
Financial data in different systems is often aggregated at a different level, by account, or account and day. Data reconciliation in accounting requires selecting common columns to match two datasets and configuring the same aggregations for both sources. The datasets can differ by an aggregation level, but if they share the same columns used for joining, they can be reconciled to detect discrepancies.
What is a data reconciliation framework?
A data reconciliation framework is a set of procedures and tools for ensuring data consistency across different systems. It typically includes data quality rules, reconciliation processes, and a notification workflow to inform data owners about discrepancies.
What are discrepancies in data reconciliation?
In data reconciliation, discrepancies are differences found between two datasets. They can be caused by various factors, such as data entry errors, system integration issues, or timing differences in data updates. Discrepancies can indicate missing, duplicate, or incorrect data.
What is data reconciliation in ETL?
Data reconciliation in ETL is the process of verifying that data is accurately and consistently transferred between the data source and different stages of the ETL pipeline.
This might involve comparing ingested data to a table in the data source. Other data reconciliation steps compare data between the ingestion, cleansing and publishing layers (data marts).
The goal is to ensure no data is lost or corrupted during the ETL process.
How to perform data reconciliation between two databases?
To perform data reconciliation between two databases, you need a data quality tool that can connect to both sources. This tool will pull data from both databases and compare them in memory. For larger datasets, you can optimize this process by aggregating and sorting the data before it's pulled into the tool. This reduces the volume of data being compared and improves performance.
What are data reconciliation tools?
Many commercial data quality tools support data reconciliation, such as WinPure and TIBCO Clarity. Alternatively, data observability tools, such as DQOps, can reconcile data and monitor additional data quality metrics to further validate the data.
What's next
- Learn how to run data quality checks filtering by a check category name
- Learn how to configure data quality checks and apply alerting rules
- Read the definition of data quality dimensions used by DQOps