Last updated: July 22, 2025
How to monitor data volume and detect empty tables, examples
Read this guide to learn how to monitor the number of rows in tables, detect empty tables, and detect unexpected increases or decreases in the volume.
The table volume monitoring checks are configured in the volume category in DQOps.
What is data volume
The data volume refers to the size of the dataset stored by an organization. The data volume of a table has two measures.
-
A logical volume is the number of rows in the table.
-
A physical volume is a physical storage size (in megabytes, gigabytes, terabytes) occupied by the table on disk.
DQOps measures a logical volume, running a row count queries on monitored tables. Monitoring the physical volume is possible by creating a custom data quality check that pulls the physical statistics of the table.
Data volume issues
Usually, unexpected data volume changes are caused by problems in the data pipeline or changes in the source system.
The problems in the data pipeline:
-
A batch was missed and not loaded into the target table.
-
A batch was loaded twice, also generating duplicate rows.
-
The data pipeline is stopped.
-
The data pipeline uses outdated credentials and cannot process the data.
The source system can also cause volume issues:
-
The source system or table was decommissioned. The data pipeline does not receive any new data.
-
The usage of the source system has changed. More or less users are accessing the source platform.
-
The content of the table was corrupted during a maintenance operation.
All these issues will affect the table volume. We can notice them by asserting a minimum row count or by detecting row count anomalies.
Data volume monitoring by DQOps
DQOps supports several methods of detecting data volume issues.
Empty tables
We can detect empty tables. The row_count check in DQOps has a min_count parameter. An empty table does not pass the data quality check because it has less than 1 row. W hen a new table is imported into DQOps using the user interface, DQOps activates the row_count check configured to raise a data quality issue at a warning severity level.
This configuration is included in the default settings of the data observability checks.
Minimum row count
We can also detect incomplete tables. An incomplete table has fewer records than the minimum number that makes sense. For example, we can monitor that the dim_products table has at least 100 records. DQOps detects too small tables using the row_count check configured with a min_count parameter set to the minimum accepted value.
Row count change anomaly
DQOps detects unexpected increases or decreases in the row count day-to-day using anomaly detection checks. Because the row count is a slowly growing measure, DQOps can detect changes by detecting bigger-than-average increases or decreases in the row count.
DQOps converts the historical row count values into a differential sequence of values. Instead of analyzing row counts for each day that could differ slightly, DQOps analyzes row count differences between following days. Let's see how DQOps calculates a differential sequence from the sequence of daily row counts.
| Date | Row count | Difference |
|---|---|---|
| 2024-01-01 | 45.600 | (none) |
| 2024-01-02 | 45.650 | +50 |
| 2024-01-03 | 45.680 | +30 |
| 2024-01-04 | 45.660 | -20 |
| 2024-01-05 | 55.660 | +10000 |
Please read the description of anomalies supported by DQOps to learn how anomaly detection works in DQOps. The anomaly detection for numeric values and table volume obeys the same rules.
Daily/weekly/monthly relative volume change
DQOps can monitor row count changes compared to a relative past date. We can avoid the influence of seasonability issues by comparing the current row count to the row count of 7 or 30 days ago. Comparing the row count on Monday to the row count on Sunday may lead to false-positive volume issues, especially when no data was loaded during the weekend.
The following table shows how DQOps calculates the row count increase in percent since a reference point seven days ago.
| Date | Row count | Reference point |
|---|---|---|
| 2024-01-01 | 45.600 | <─┐ |
| 2024-01-02 | 45.650 | │ |
| 2024-01-03 | 45.680 | │ |
| 2024-01-04 | 45.660 | │ |
| 2024-01-05 | 45.690 | │ |
| 2024-01-06 | 45.720 | │ |
| 2024-01-07 | 45.750 | │ |
| 2024-01-08 | 45.780 | ──┘ (+180 rows or +0.39%) |
Minimum partition row count
The row_count check is also applicable to partition checks in DQOps. The daily_partition_row_count and monthly_partition_row_count checks measure the row count of daily or monthly partitions. When partitioned checks are applied to time-oriented tables not physically partitioned by the date column, DQOps measures the number of rows for a daily or monthly period.
Partition row count anomaly
Data volume anomaly detection also works for partitions. A daily partitioned variant daily_partition_row_count of the row_count check detects anomalies by comparing the size of daily partitions. Anomalous partitions are smaller or bigger than the average partition size.
Daily table volume monitoring
The daily_row_count data quality check is a table-level check in the volume category.
Detect empty tables in UI
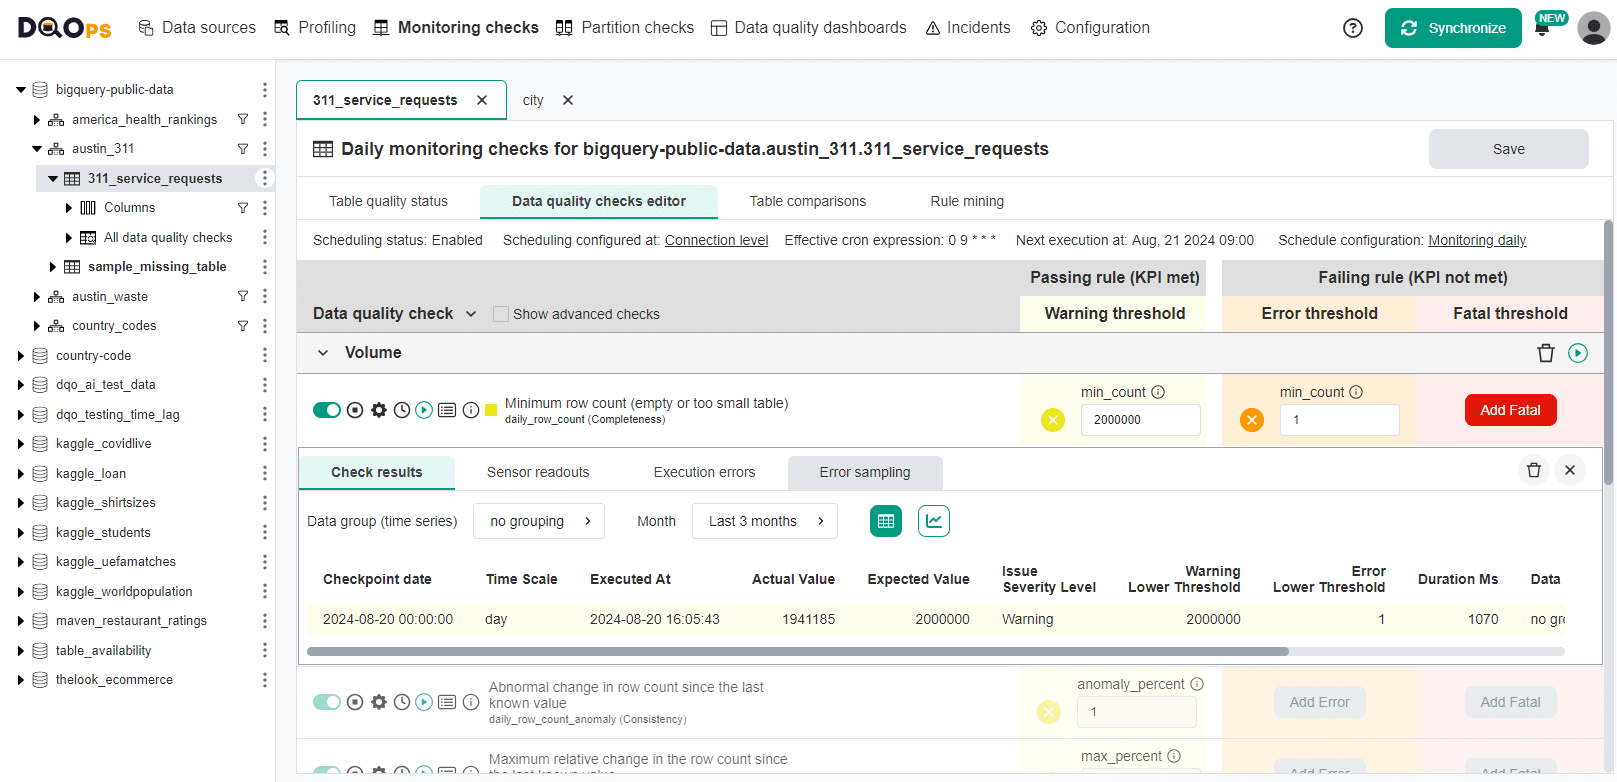
The default configuration of the daily_row_count check sets the value of the min_count parameter to 1. This configuration asserts that the table is not empty, having at least one row.

Detect too small tables in UI
We can increase the value of the min_count parameter to set the desired minimum size of the table. By doing this, we will receive a warning if the number of rows falls below 2,000,000.
We can set up multiple thresholds in the advanced Check editor mode. To switch to the Advanced mode, choose the Multiple levels option from the Issue severity level dropdown menu in the simplified Check editor. You can find more information about the Check editor modes in the DQOps user interface overview section.
Configuring row count check in YAML
The row count check is straightforward to configure in the table YAML file.
Reviewing empty or incomplete tables on the dashboard
The empty or too small tables dashboard shows data volume issues identified by the daily_row_count check. The dashboard presented below shows issues detected by daily monitoring checks. There is also a data profiling version of the dashboard in the profiling folder of the data quality dashboard tree.

(click to expand)
Monitoring partition's row count
Monitoring partition sizes (row counts) is similar to tracking the row count of the whole table in the Monitoring checks section.
The daily_partition_row_count check is a variant of
the row_countcheck that applies a GROUP BY <partition_by_column>
condition to the row count SQL query.
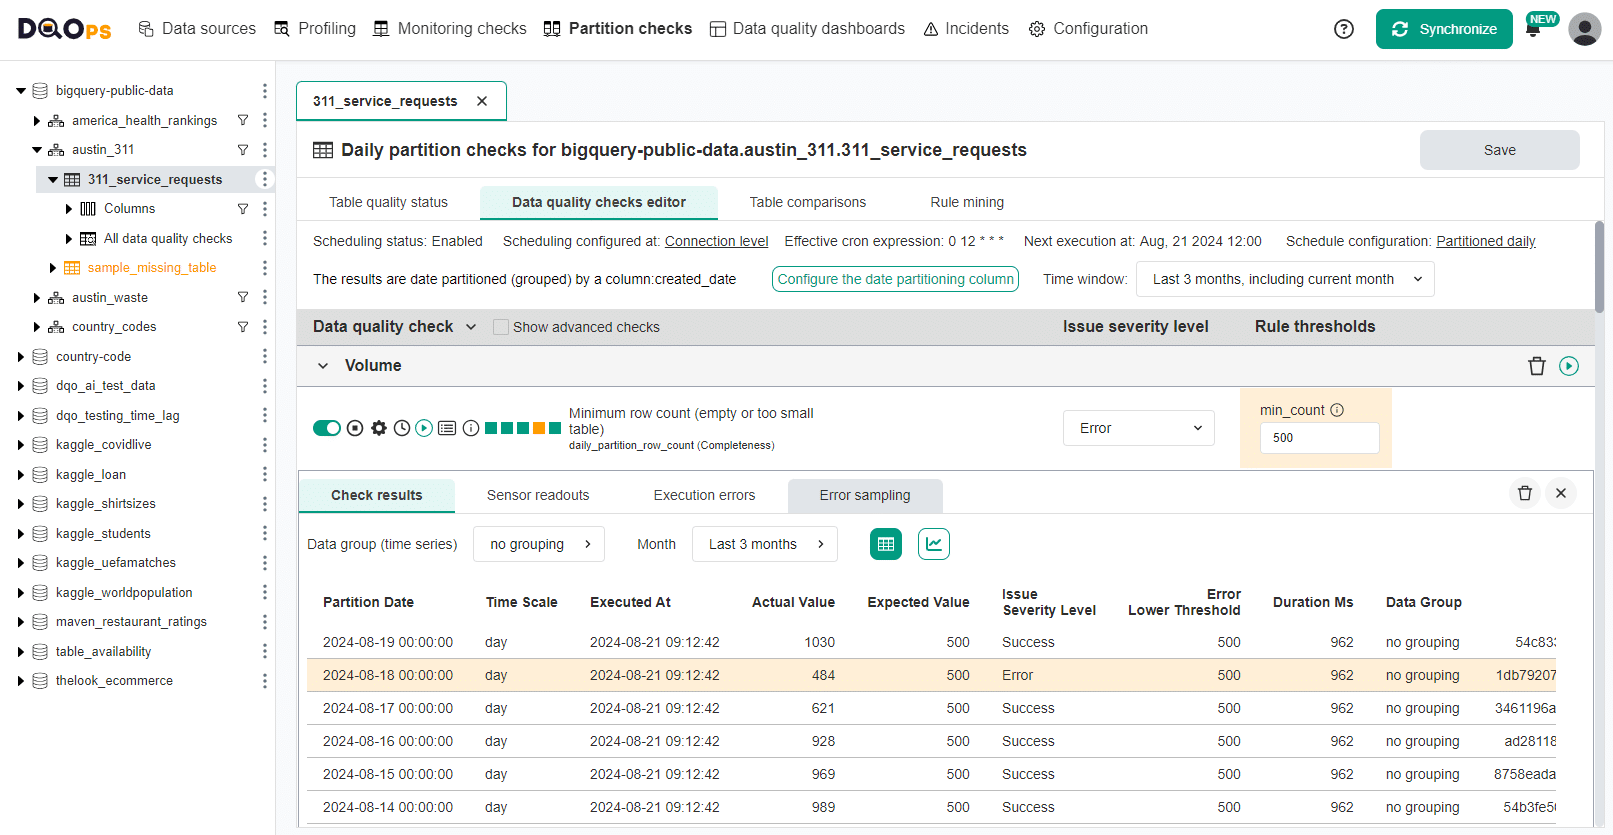
Measure minimum partition size in UI
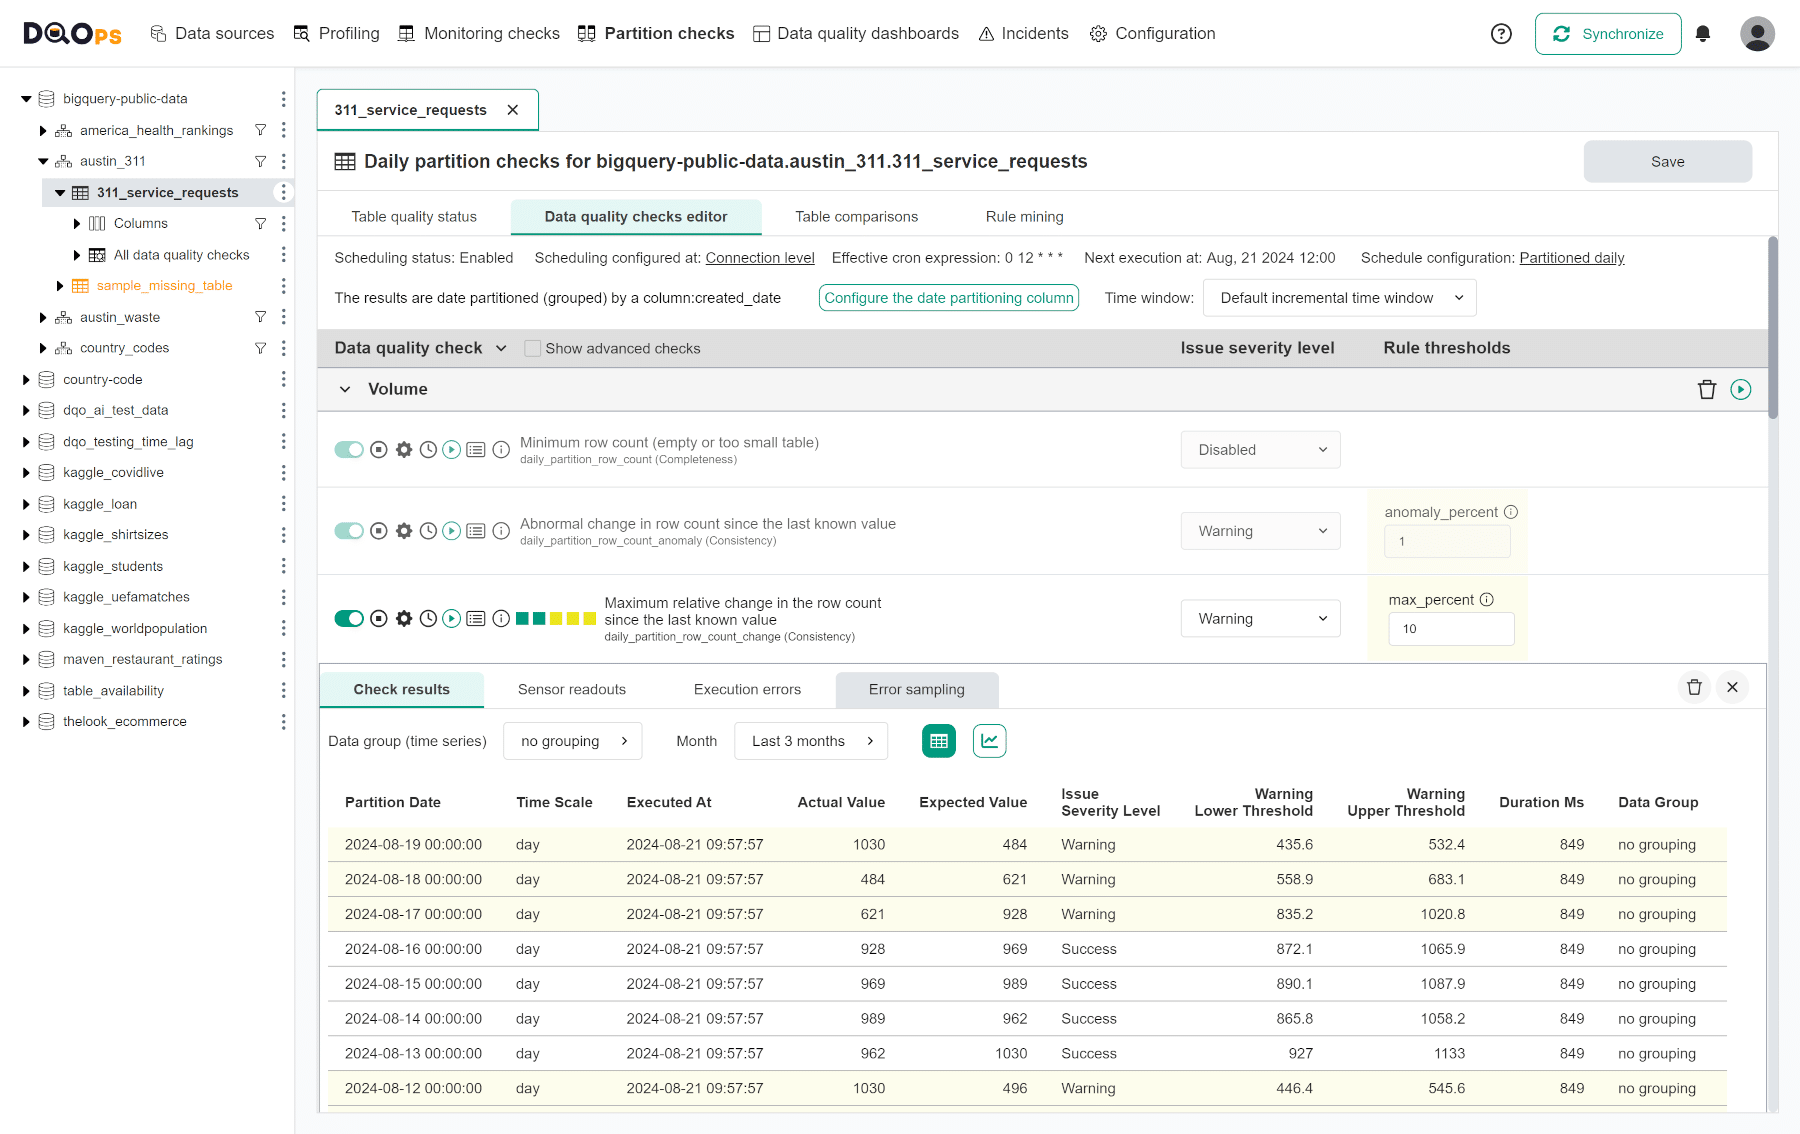
DQOps shows the row counts of daily or monthly partitions when a partitioned version of the check is run. Partitions that are below a minimum size are highlighted.
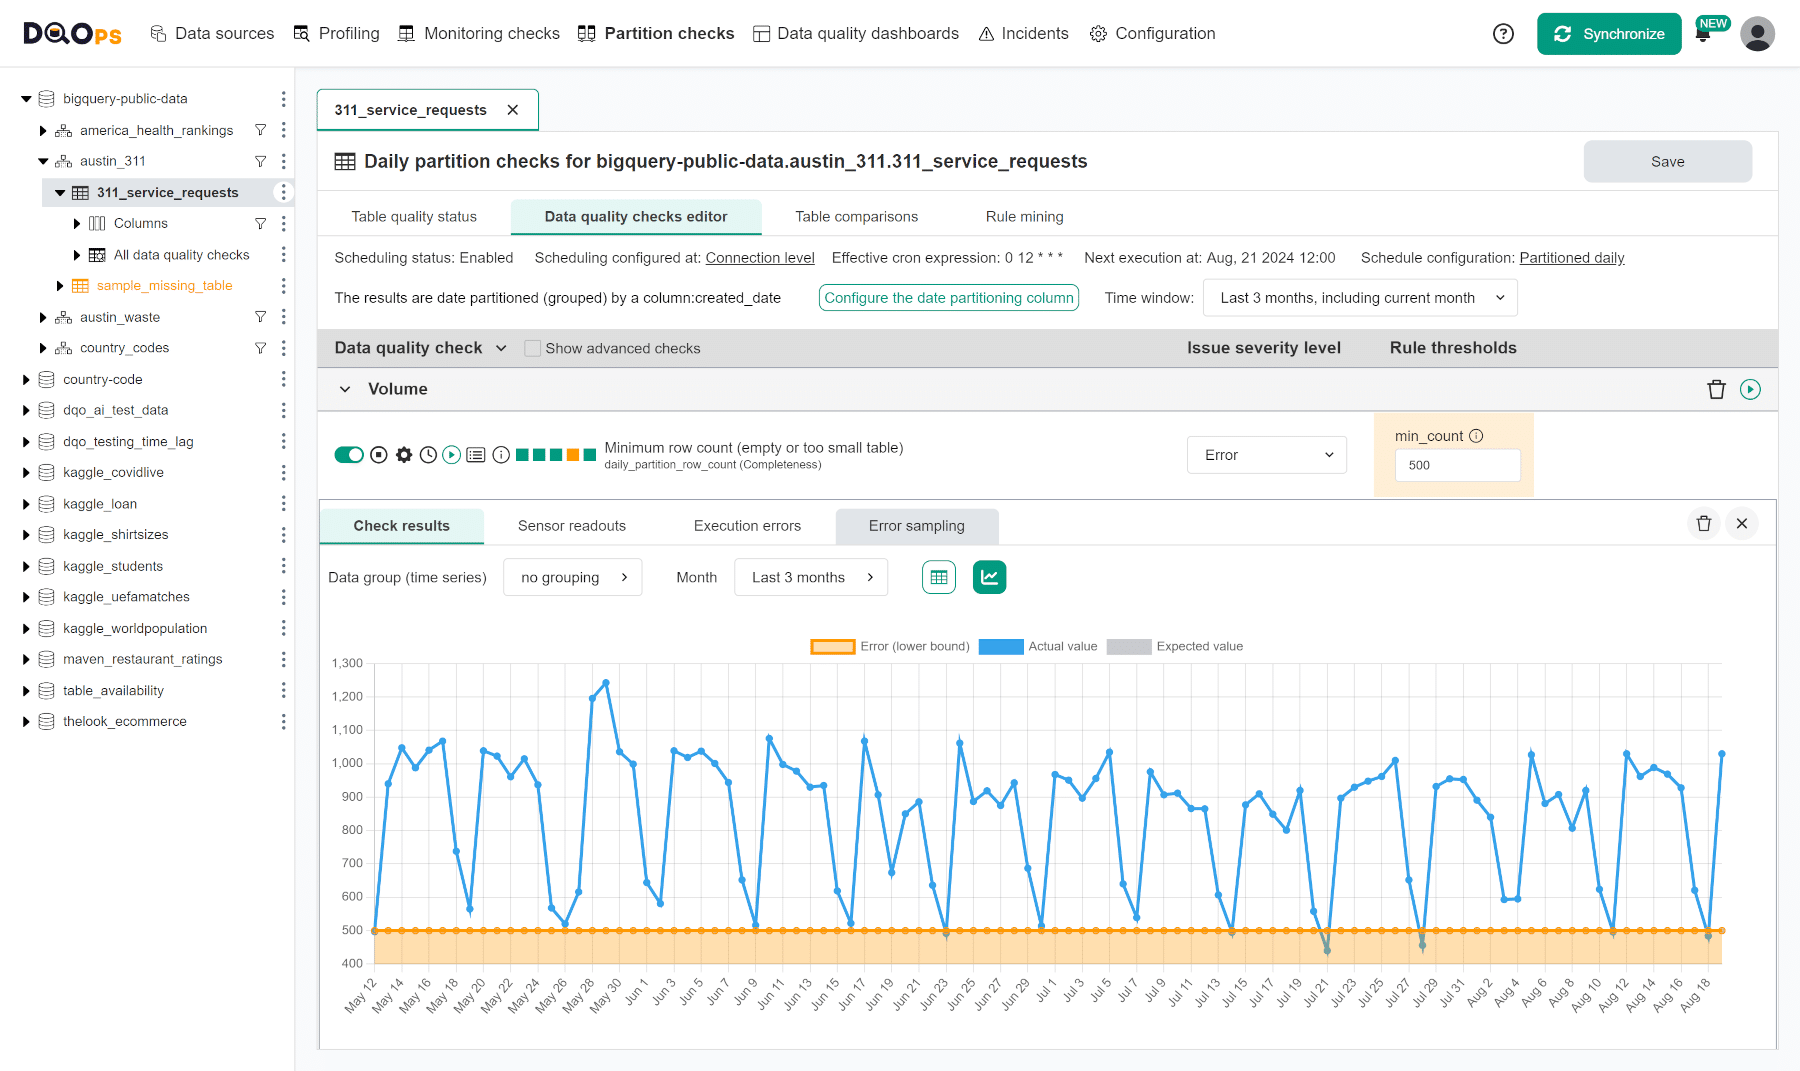
Partition sizes chart
The view of the partition sizes can be switched from a table view to a chart view.
The chart shows too small daily partitions on the yellow part of the chart, below the minimum row count threshold line.
Configuring partition volume check in YAML
The configuration of the partition row count check requires a proper configuration of the partition_by_column column name. Please follow the documentation of partitioned checks to learn how to activate partitioned checks. The configuration of the partitioning column is shown below for reference.
- The configuration of the partition_by_column column required by partition checks.
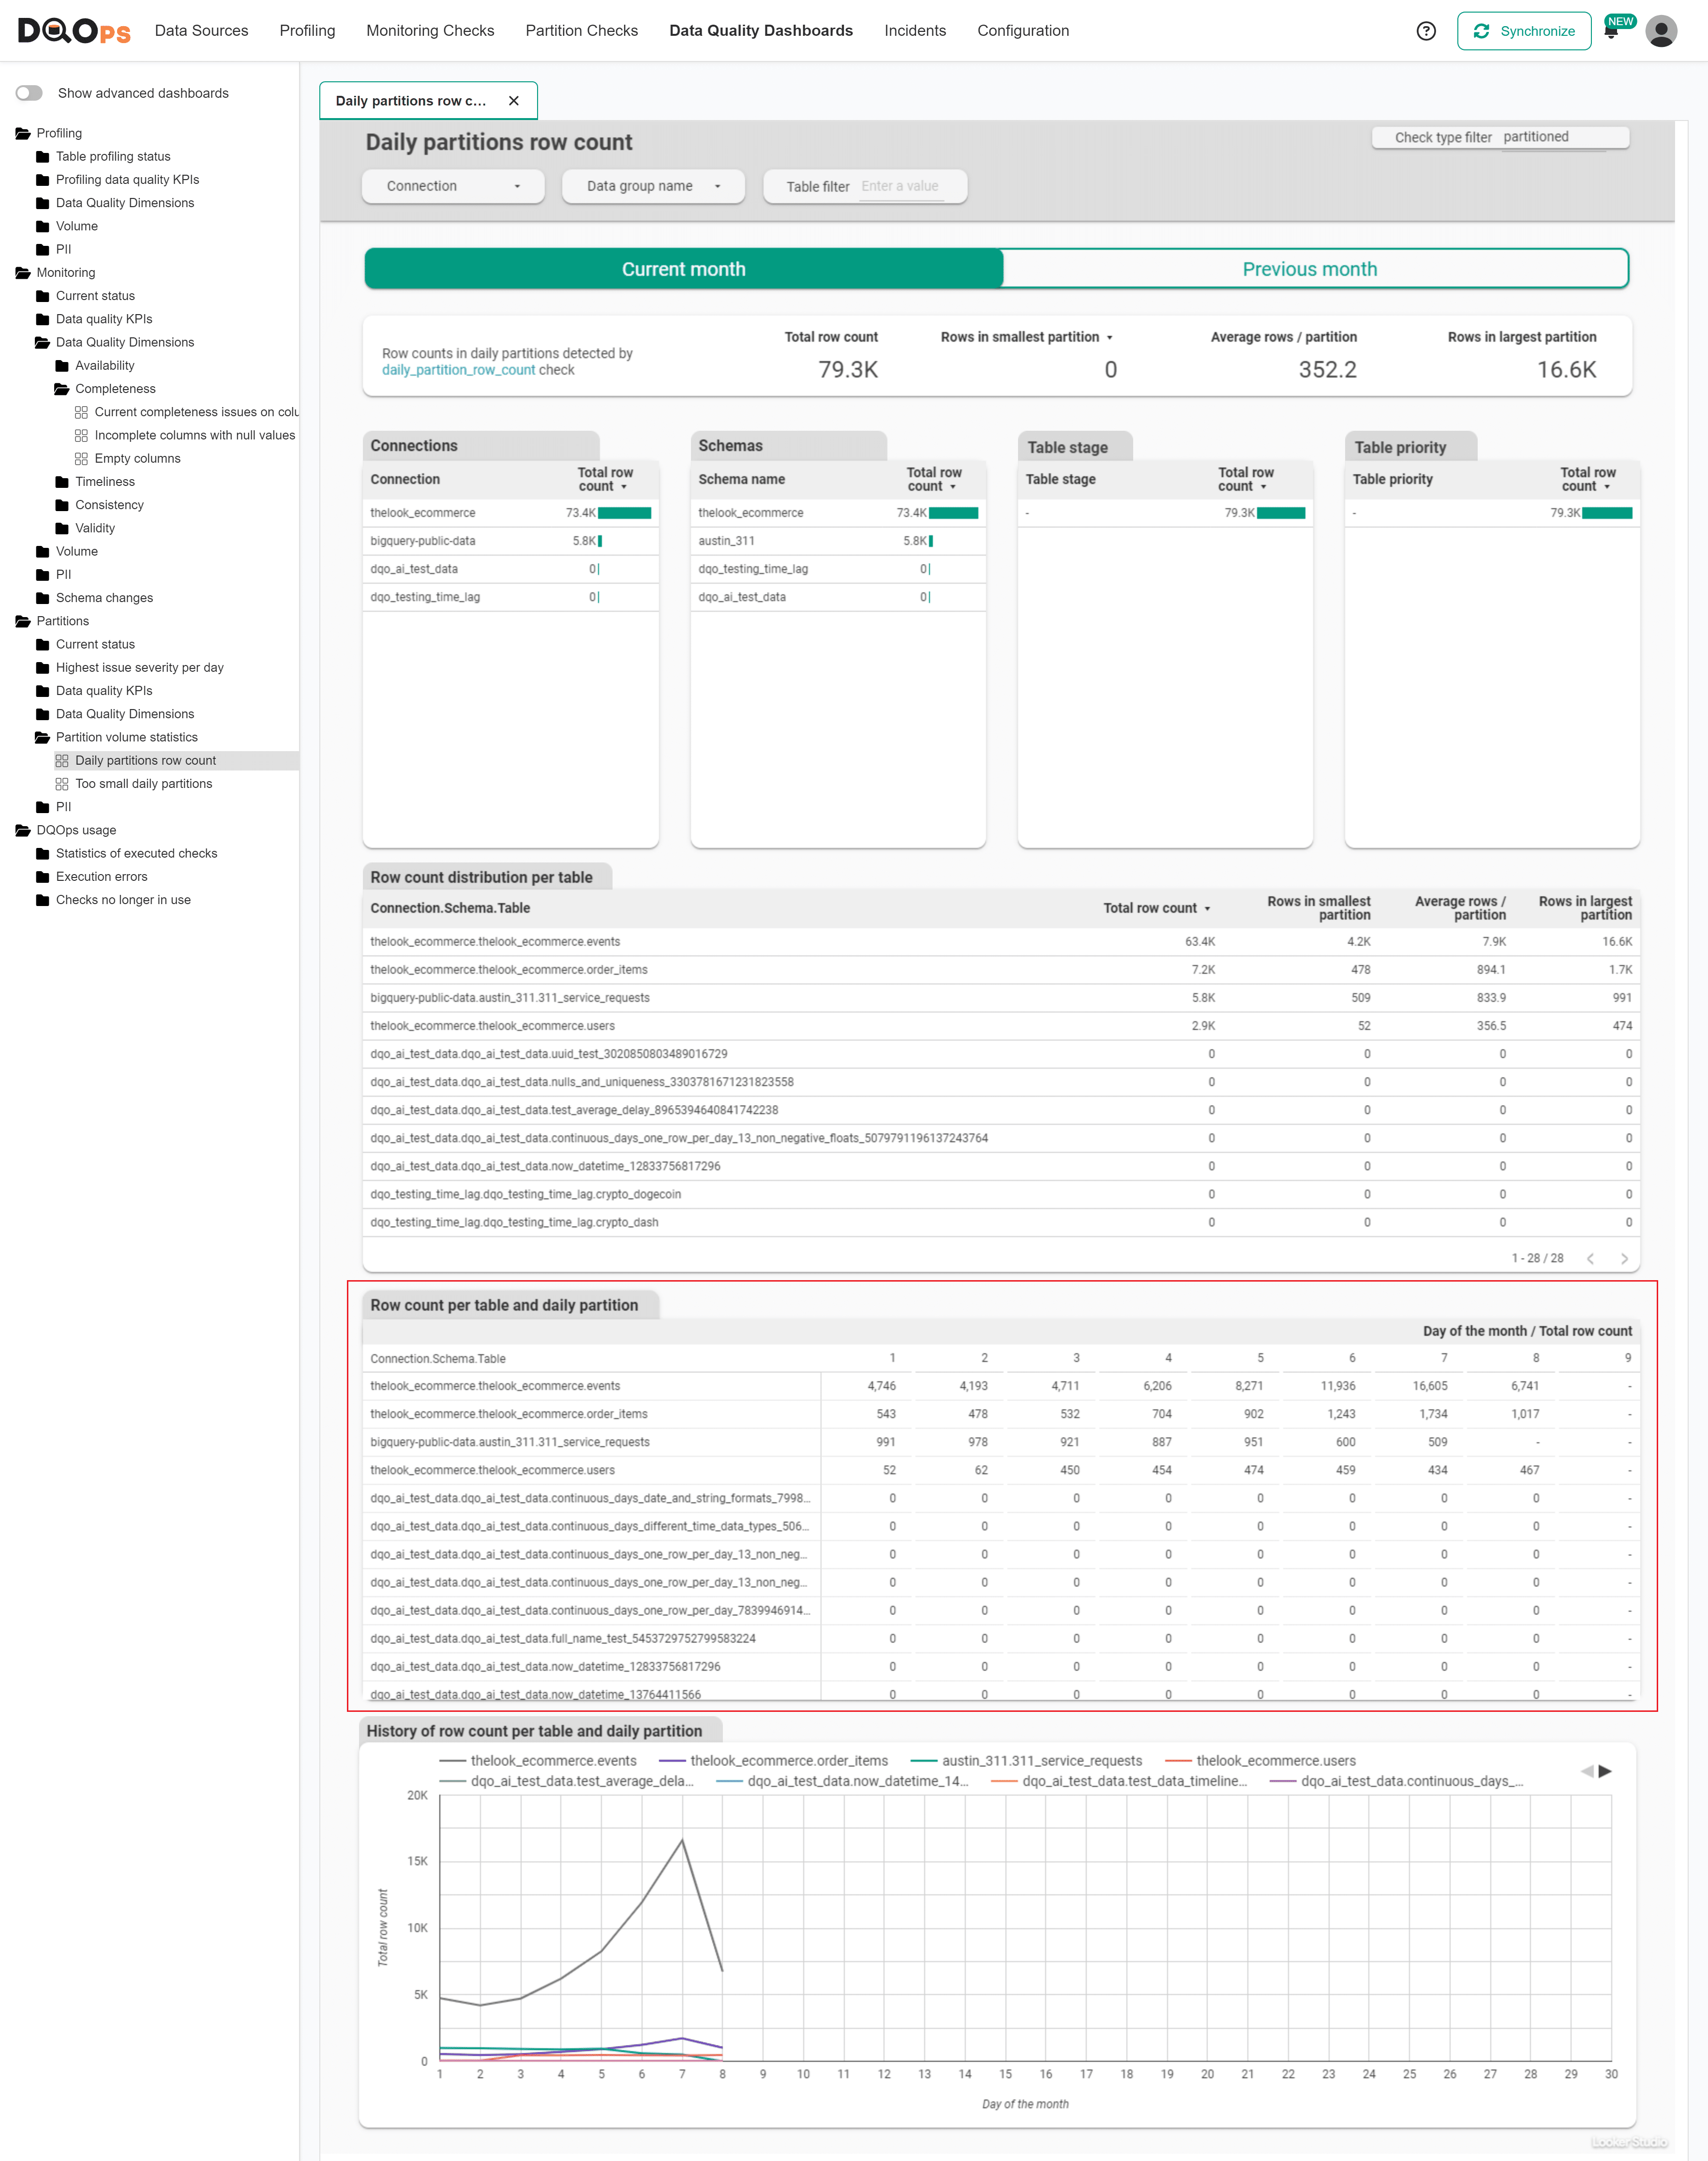
Identifying too small partitions on dashboards
The daily partitions row count dashboard shows the list of partitioned tables. The row count for each day is shown in a pivot table.
(click to expand)
Detecting volume anomalies
Anomaly detection for the data volume uses the same concept as detecting numeric anomalies.
Row count anomaly checks
The row_count_anomaly data quality check detects volume anomalies in two modes:
-
A daily monitoring check daily_row_count_anomaly calculates the row count difference since the previous day. The anomalous values are abnormal increases or decreases in the data volume.
-
A daily partition check daily_partition_row_count_anomaly check detects volume anomalies by detecting bigger or smaller daily partitions. The difference in row count between the following days is not analyzed.
Row count anomaly chart
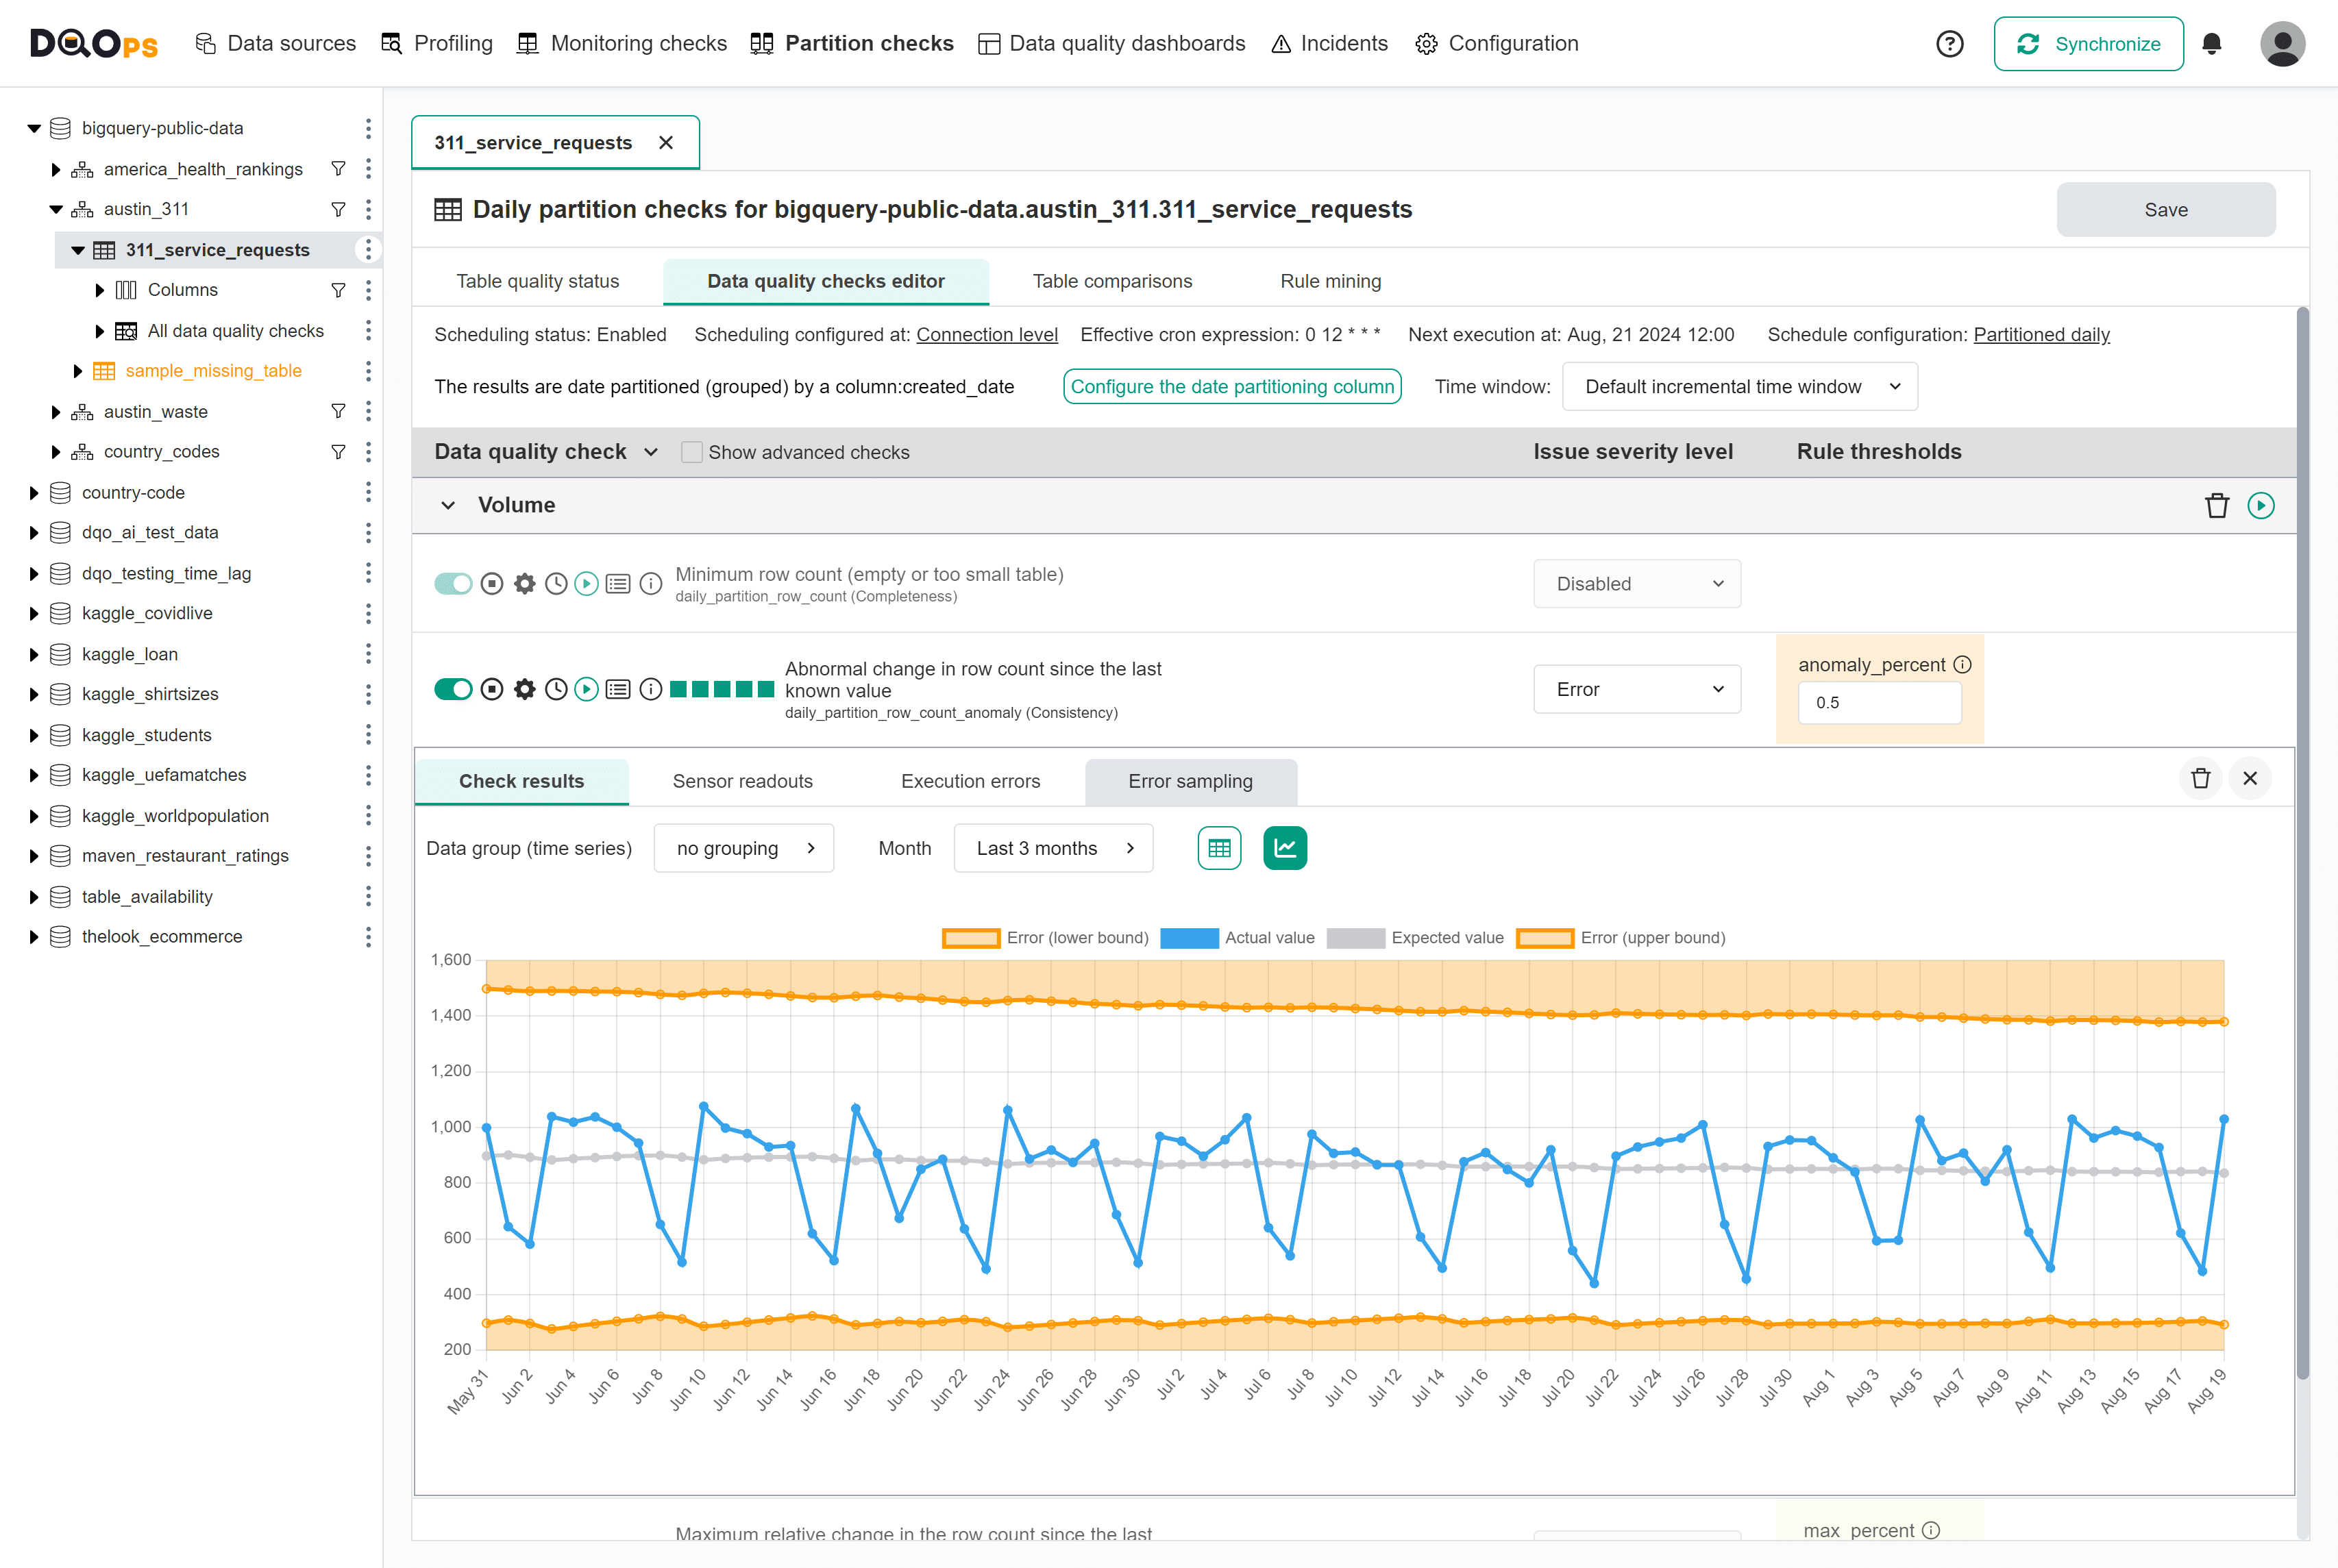
The following example shows a chart view of the daily_partition_row_count_anomaly for daily partitions.
The chart is the same for a daily monitoring check daily_row_count_anomaly that measures the whole table and detects daily row count increases/decreases.
Detecting anomalies at multiple severity levels
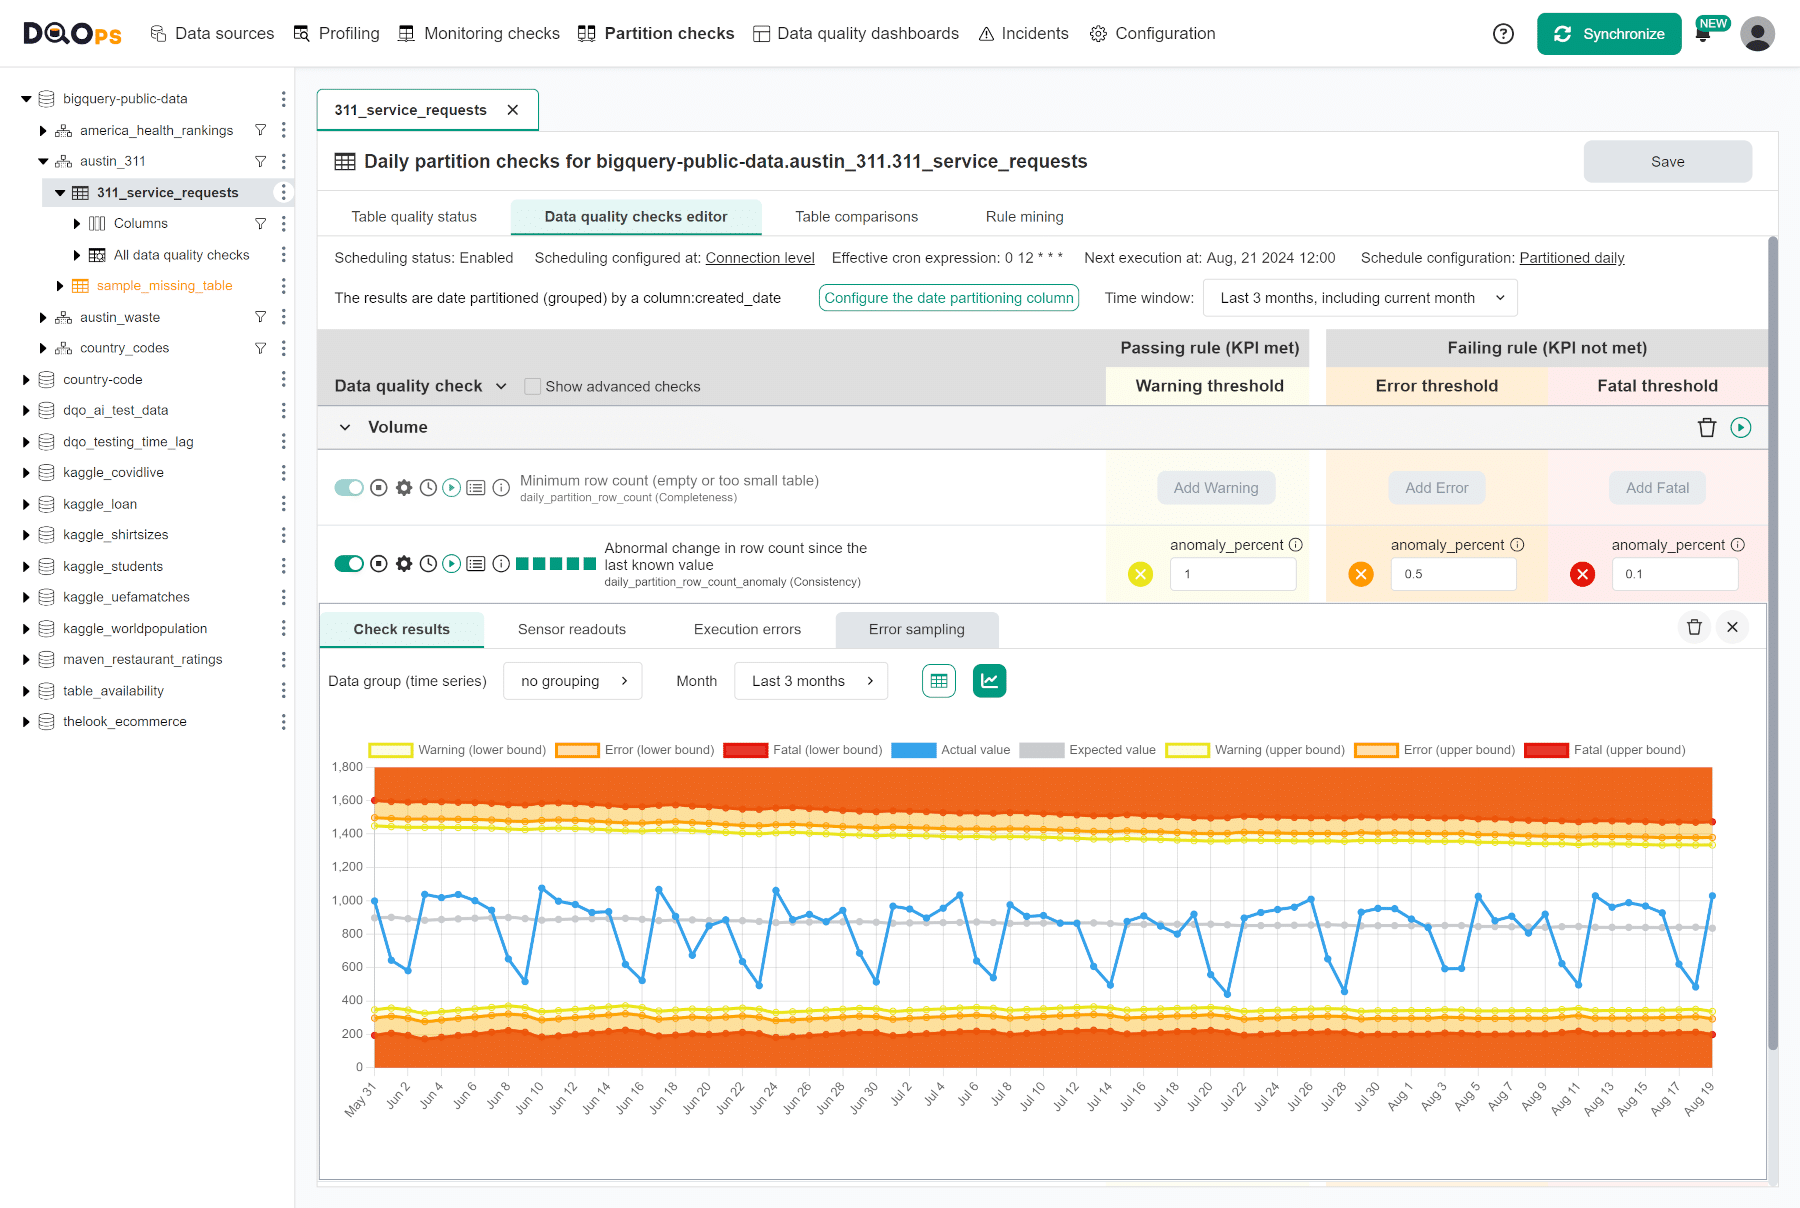
The chart below shows how DQOps presents a row count anomaly check with different values of the anomaly_percent parameters at various issue severity levels (warning, error, fatal).
We can set up multiple thresholds in the advanced Check editor mode. To switch to the Advanced mode, choose the Multiple levels option from the Issue severity level dropdown menu in the simplified Check editor. You can find more information about the Check editor modes in the DQOps user interface overview section.
Configuring anomaly detection in YAML
The following example of a DQOps YAML file shows the configuration of the daily_row_count_anomaly check at multiple severity levels.
Detecting volume relative change
DQOps supports detecting significant changes in data volume compared to the last known row count or a reference value from a previous point in time.
- The row_count_change check compares the current row count to the last known row count. The daily monitoring checks will use a value from the previous day or older.
The data quality checks listed below are classified as non-standard checks. To display non-standard checks, select the Show advanced checks checkbox at the top left of the Check editor table.
-
The row_count_change_1_day check compares the current row count to a value from yesterday. If DQOps did not measure the row count on the previous day, DQOps skips this check or finds an older result. The row_count_change_1_day and row_count_change checks differ only by one parameter. The row_count_change_1_day check can be configured to compare the row count to the value from the previous day only when that value was captured.
-
The row_count_change_7_days compares the current row count to a count captured seven days ago. This behavior avoids the influence of weekly seasonality by comparing Mondays to Mondays, Tuesdays to Tuesdays, etc.
-
The row_count_change_30_days compares the current row count to a count captured thirty days ago. This behavior will detect the volume change since the previous month, avoiding the influence of monthly seasonality.
All these checks take one data quality rule parameter. The max_percent parameter sets the maximum accepted relative change in percent. A value of 10.0 means that DQOps raises a data quality issue when the row count drops by 10% or increases by 10%.
Configuring volume relative change check in UI
The row_count_change check takes one parameter max_percent. It sets the maximum accepted row count change since the previous known value or a relative value a week or a month ago.
Configuring volume relative change check in YAML
The configuration of the row_count_change check is simple.
Use cases
| Name of the example | Description |
|---|---|
| Detect empty or incomplete tables | This example shows how to find empty or too small tables using the row_count check. |
List of volume checks at a table level
| Data quality check name | Friendly name | Data quality dimension | Description | Standard check |
|---|---|---|---|---|
| row_count | Minimum row count (empty or too small table) | Completeness | This check detects empty or too-small tables. It captures the row count of a tested table. This check raises a data quality issue when the row count is below a minimum accepted value. The default value of the rule parameter min_count is 1 (row), which detects empty tables. When the data grouping is configured, this check will count rows using a GROUP BY clause and verify that each data grouping has an expected minimum number of rows. | |
| row_count_anomaly | Abnormal change in row count since the last known value | Consistency | This check detects anomalies in the day-to-day changes to the table volume (the row count). It captures the row count for each day and compares the row count change (increase or decrease) since the previous day. This check raises a data quality issue when the change is in the top anomaly_percent percentage of the biggest day-to-day changes. | |
| row_count_change | Maximum relative change in the row count since the last known value | Consistency | This check compares the current table volume (the row count) to the last known row count. It raises a data quality issue when the change in row count (increase or decrease) exceeds a maximum accepted percentage of change. | |
| row_count_change_1_day | Maximum relative change in the row count vs 1 day ago | Consistency | This check compares the current table volume (the row count) to the row count from the previous day. It raises a data quality issue when the change in row count (increase or decrease) since yesterday exceeds a maximum accepted percentage of change. | |
| row_count_change_7_days | Maximum relative change in the row count vs 7 days ago | Consistency | This check compares the current table volume (the row count) to the row count seven days ago. This check compares the table volume to a value a week ago to overcome weekly seasonability and to compare Mondays to Mondays, Tuesdays to Tuesdays, etc. It raises a data quality issue when the change in row count (increase or decrease) since a week ago exceeds a maximum accepted percentage of change. | |
| row_count_change_30_days | Maximum relative change in the row count vs 30 days ago | Consistency | This check compares the current table volume (the row count) to the row count 30 days ago. This check compares the table volume to a month ago value to overcome monthly seasonability. It raises a data quality issue when the change in row count (increase or decrease) since a value 30 days ago exceeds a maximum accepted percentage of change. |
Reference and samples
The full list of all data quality checks in this category is located in the table/volume reference. The reference section provides YAML code samples that are ready to copy-paste to the .dqotable.yaml files, the parameters reference, and samples of data source specific SQL queries generated by data quality sensors that are used by those checks.
What's next
- Learn how to run data quality checks filtering by a check category name
- Learn how to configure data quality checks and apply alerting rules
- Read the definition of data quality dimensions used by DQOps