Last updated: July 22, 2025
How to detect out-of-range numbers? Examples and Best Practices
Read this guide to learn how to detect numeric values that are out of an accepted range and how to raise a data quality issue.
The data quality checks responsible for numeric values are configured in the numeric category in DQOps.
Common data quality issues with numbers
We can categorize data quality issues affecting numeric fields into three types.
-
Some values are out-of-range. Some numeric values are below or above a maximum accepted value.
-
An aggregated measure is out-of-range. A sum, min, max, or mean value is above or below an assumed value.
-
Anomalous values appeared recently in numeric columns. A time series prediction detected data outliers.
The data quality checks in the numerics category are responsible for detecting the first two types of issues.
DQOps has a separate category of data quality checks that detect anomalies in numeric fields.
Please read the guide for detecting numeric anomalies to learn more.
Numerical statistics
The quickest method for identifying out-of-range values is by examining the basic statistics collected by DQOps. We can review the minimum and maximum values on the column's statistics screen. We can also review the values of aggregate metrics, such as median, sum or mean value.

Detecting out-of-range numbers
The out-of-range values are relatively easy to find. A data quality check runs an SQL query that finds values above
or below an accepted value, using a condition WHERE tested_column < {accepted value}.
Examples of out-of-range numbers
Many numeric columns represent values from a well-known domain. It is obvious why some values must be invalid.
-
An age column should be between 0 and 100 or even 120.
-
The age of an adult person should be at least 18 or 21 years.
-
Some columns representing a bounded percentage must be between 0% and 100%.
-
A numeric column that stores a fraction should be between 0.0 and 1.0.
-
The tax rate column should be between 1% and 99%, but a VAT or sales tax value is within a smaller range.
We can detect many obvious mistakes by activating a numeric range data quality check on these columns.
Out-of-range numbers checks
DQOps has several easy-to-use data quality checks that detect any values out-of-range or raise a data quality issue when too many out-of-range values are present in the dataset.
The following checks detect any out-of-range values.
-
number_below_min_value check detects any numeric values below a minimum accepted value.
-
number_above_max_value check detects any numeric values above a maximum accepted value.
-
negative_values detects any negative (less than 0) values.
We can also measure the percentage of out-of-range values and raise a data quality issue when too many invalid values are present.
-
negative_values_percent measures the percentage of negative values.
-
number_below_min_value_percent check finds numeric values below an accepted minimum value and measures their percentage in the dataset.
-
number_above_max_value_percent check finds numeric values above an accepted maximum value and measures their percentage in the dataset.
-
number_in_range_percent check measures the percentage of numeric values within a lower and upper limit.
-
integer_in_range_percent check measures the percentage of numeric values within a lower and upper limit but for integer data types.
We can also detect values that are out-of-range for less common ranges.
-
invalid_latitude check detects values that are not valid latitude coordinates. Latitude must be between -90 and 90 degrees.
-
valid_latitude_percent measures the percentage of valid latitude values.
-
invalid_longitude check detects values that are not valid longitude coordinates. Longitude must be between -180 and 180 degrees.
-
valid_longitude_percent measures the percentage of valid longitude values.
-
non_negative_values check detects non-negative values if only negative values are expected.
-
non_negative_values_percent check measures the percentage of non-negative values.
Detect invalid numbers in UI
The data quality checks for finding invalid data are configured by setting the max_count limit, which defaults to zero accepted out-of-range values. The lowest or highest accepted value is also configurable for checks that do not have a well-known boundary, such as 0 for negative values.
The following example shows the configuration of the number_above_max_value check.

Detect invalid numbers in YAML
The number_above_max_value check is straightforward to configure in YAML.
Invalid numbers error sampling in UI
To assist with identifying the root cause of errors and cleaning up the data, DQOps offers error sampling for this check. Let's modify the max_value parameter to 9. Running the checks resulted in warning. You can view representative examples of data that do not meet the specified data quality criteria by clicking on the Error sampling tab in the results section.

For additional information about error sampling, please refer to the Data Quality Error Sampling documentation.
Aggregate value out-of-range
Instead of detecting out-of-range values in the whole dataset, we can calculate an aggregated measure and compare it to a valid range.
The typical aggregate measures are min, max, sum, mean (average), and median. Additional statistical measures are percentiles, variance (standard deviation), population, and sample variance. All these checks verify the collected measure by inspecting if the value is within an accepted range of valid values.
Please go to the table of all numeric checks at the bottom of this article to see the list of supported measures.
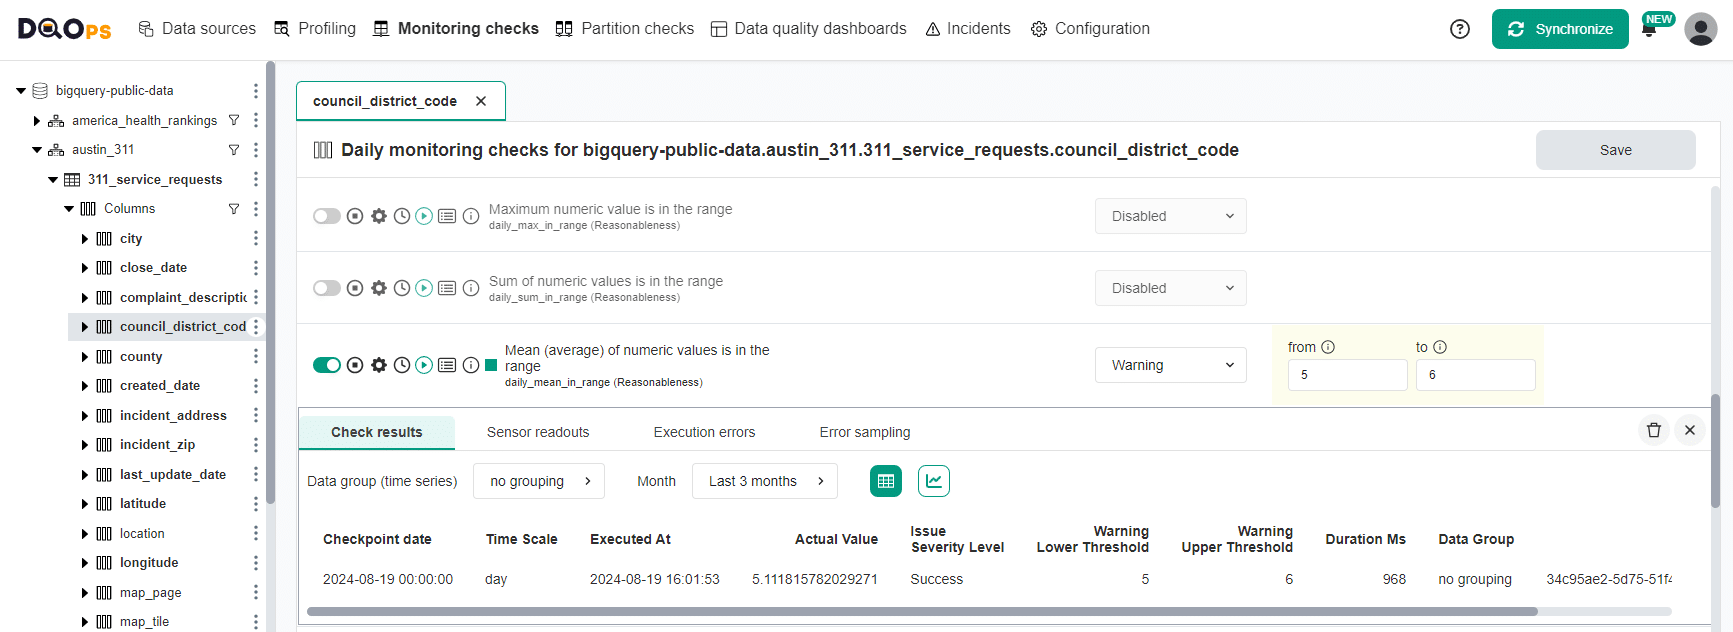
Activating an aggregate check in UI
DQOps shows these measures when the Show advanced checks are enabled with a checkbox at the top of the data quality check editor screen.
The following example shows the mean_in_range data quality check configured in the editor.
Activating an aggregate check inYAML
The mean_in_range check is straightforward to configure in YAML.
Use cases
| Name of the example | Description |
|---|---|
| Percentage of negative values | This example shows how to detect that the percentage of negative values in a column does not exceed a set threshold using negative_values_percent check. |
| Percentage of values in range | This example shows how to detect that the percentage of values within a set range in a column does not exceed a set threshold using integer_in_range_percent check. |
| Percentage of valid latitude and longitude | This example shows how to detect that the percentage of valid latitude and longitude values remain above a set threshold using valid_latitude_percent and valid_longitude_percent checks. |
List of numeric checks at a column level
| Data quality check name | Friendly name | Data quality dimension | Description | Standard check |
|---|---|---|---|---|
| number_below_min_value | Find invalid numeric values below an expected minimum value | Validity | This check finds numeric values smaller than the minimum accepted value. It counts the values that are too small. This check raises a data quality issue when the count of too small values exceeds the maximum accepted count. | |
| number_above_max_value | Find invalid numeric values above an expected maximum value | Validity | This check finds numeric values bigger than the maximum accepted value. It counts the values that are too big. This check raises a data quality issue when the count of too big values exceeds the maximum accepted count. | |
| negative_values | Maximum count of negative values | Validity | This check finds and counts negative values in a numeric column. It raises a data quality issue when the count of negative values is above the maximum accepted count. | |
| negative_values_percent | Maximum percentage of negative values | Validity | This check finds negative values in a numeric column. It measures the percentage of negative values and raises a data quality issue when the rate of negative values exceeds the maximum accepted percentage. | |
| number_below_min_value_percent | Maximum percentage of numeric values below the minimum value | Validity | This check finds numeric values smaller than the minimum accepted value. It measures the percentage of values that are too small. This check raises a data quality issue when the percentage of values that are too small exceeds the maximum accepted percentage. | |
| number_above_max_value_percent | Maximum percentage of numeric values above the maximum value | Validity | This check finds numeric values bigger than the maximum accepted value. It measures the percentage of values that are too big. This check raises a data quality issue when the percentage of values that are too big exceeds the maximum accepted percentage. | |
| number_in_range_percent | Maximum percentage of rows containing numeric values in the range | Reasonableness | This check verifies that values in a numeric column are within an accepted range. It measures the percentage of values within the valid range and raises a data quality issue when the rate of valid values is below a minimum accepted percentage. | |
| integer_in_range_percent | Maximum percentage of rows containing integer values in the range | Reasonableness | This check verifies that numeric values are within a range of accepted values. It measures the percentage of values in the range and raises a data quality issue when the percentage of valid values is below an accepted rate. | |
| min_in_range | Minimum numeric value is in the range | Reasonableness | This check finds a minimum value in a numeric column. It verifies that the minimum value is within the range of accepted values and raises a data quality issue when it is not within a valid range. | |
| max_in_range | Maximum numeric value is in the range | Reasonableness | This check finds a maximum value in a numeric column. It verifies that the maximum value is within the range of accepted values and raises a data quality issue when it is not within a valid range. | |
| sum_in_range | Sum of numeric values is in the range | Reasonableness | This check calculates a sum of numeric values. It verifies that the sum is within the range of accepted values and raises a data quality issue when it is not within a valid range. | |
| mean_in_range | Mean (average) of numeric values is in the range | Reasonableness | This check calculates a mean (average) value in a numeric column. It verifies that the average value is within the range of accepted values and raises a data quality issue when it is not within a valid range. | |
| median_in_range | Median of numeric values is in the range | Reasonableness | This check finds a median value in a numeric column. It verifies that the median value is within the range of accepted values and raises a data quality issue when it is not within a valid range. | |
| percentile_in_range | The selected percentile of numeric values is in the range | Reasonableness | This check finds a requested percentile value of numeric values. The percentile is configured as a value in the range [0, 1]. This check verifies that the given percentile is within the range of accepted values and raises a data quality issue when it is not within a valid range. | |
| percentile_10_in_range | The selected 10th percentile of numeric values is in the range | Reasonableness | This check finds the 10th percentile value in a numeric column. The 10th percentile is a value greater than 10% of the smallest values and smaller than the remaining 90% of other values. This check verifies that the 10th percentile is within the range of accepted values and raises a data quality issue when it is not within a valid range. | |
| percentile_25_in_range | The selected 25th percentile of numeric values is in the range | Reasonableness | This check finds the 25th percentile value in a numeric column. The 10th percentile is a value greater than 25% of the smallest values and smaller than the remaining 75% of other values. This check verifies that the 25th percentile is within the range of accepted values and raises a data quality issue when it is not within a valid range. | |
| percentile_75_in_range | The selected 75th percentile of numeric values is in the range | Reasonableness | This check finds the 75th percentile value in a numeric column. The 75th percentile is a value greater than 75% of the smallest values and smaller than the remaining 25% of other values. This check verifies that the 75th percentile is within the range of accepted values and raises a data quality issue when it is not within a valid range. | |
| percentile_90_in_range | The selected 90th percentile of numeric values is in the range | Reasonableness | This check finds the 90th percentile value in a numeric column. The 90th percentile is a value greater than 90% of the smallest values and smaller than the remaining 10% of other values. This check verifies that the 90th percentile is within the range of accepted values and raises a data quality issue when it is not within a valid range. | |
| sample_stddev_in_range | Standard deviation of numeric values is in the range | Reasonableness | This check calculates the standard deviation of numeric values. It verifies that the standard deviation is within the range of accepted values and raises a data quality issue when it is not within a valid range. | |
| population_stddev_in_range | Population standard deviation of numeric values is in the range | Reasonableness | This check calculates the population standard deviation of numeric values. It verifies that the population standard deviation is within the range of accepted values and raises a data quality issue when it is not within a valid range. | |
| sample_variance_in_range | Variance of numeric values is in the range | Reasonableness | This check calculates a sample variance of numeric values. It verifies that the sample variance is within the range of accepted values and raises a data quality issue when it is not within a valid range. | |
| population_variance_in_range | Population variance of numeric values is in the range | Reasonableness | This check calculates a population variance of numeric values. It verifies that the population variance is within the range of accepted values and raises a data quality issue when it is not within a valid range.o | |
| invalid_latitude | Maximum count of rows containing invalid latitude values | Validity | This check finds numeric values that are not valid latitude coordinates. A valid latitude coordinate is in the range -90...90. It counts the values outside a valid range for a latitude. This check raises a data quality issue when the count of invalid values exceeds the maximum accepted count. | |
| valid_latitude_percent | Minimum percentage of rows containing valid latitude values | Validity | This check verifies that numeric values are valid latitude coordinates. A valid latitude coordinate is in the range -90...90. It measures the percentage of values within a valid range for a latitude. This check raises a data quality issue when the rate of valid values is below the minimum accepted percentage. | |
| invalid_longitude | Maximum count of rows containing invalid longitude values | Validity | This check finds numeric values that are not valid longitude coordinates. A valid longitude coordinate is in the range -180...180. It counts the values outside a valid range for a longitude. This check raises a data quality issue when the count of invalid values exceeds the maximum accepted count. | |
| valid_longitude_percent | Minimum percentage of rows containing valid longitude values | Validity | This check verifies that numeric values are valid longitude coordinates. A valid longitude coordinate is in the range --180...180. It measures the percentage of values within a valid range for a longitude. This check raises a data quality issue when the rate of valid values is below the minimum accepted percentage. | |
| non_negative_values | Maximum count of rows containing non negative values | Validity | This check finds and counts non negative values in a numeric column. It raises a data quality issue when the count of non-negative values is above the maximum accepted count. | |
| non_negative_values_percent | Maximum percentage of rows containing non negative values | Validity | This check finds non-negative values in a numeric column. It measures the percentage of non-negative values and raises a data quality issue when the rate of non-negative values exceeds the maximum accepted percentage. |
Reference and samples
The full list of all data quality checks in this category is located in the column/numeric reference. The reference section provides YAML code samples that are ready to copy-paste to the .dqotable.yaml files, the parameters reference, and samples of data source specific SQL queries generated by data quality sensors that are used by those checks.
What's next
- Learn how to run data quality checks filtering by a check category name
- Learn how to configure data quality checks and apply alerting rules
- Read the definition of data quality dimensions used by DQOps